Since replication, replicability, and generalizability have become such important topics in the field of network psychometrics — arguably the topic of the year 2017 — I want to highlight seven new papers that came out in the last weeks on the topic.
7 papers on replicability
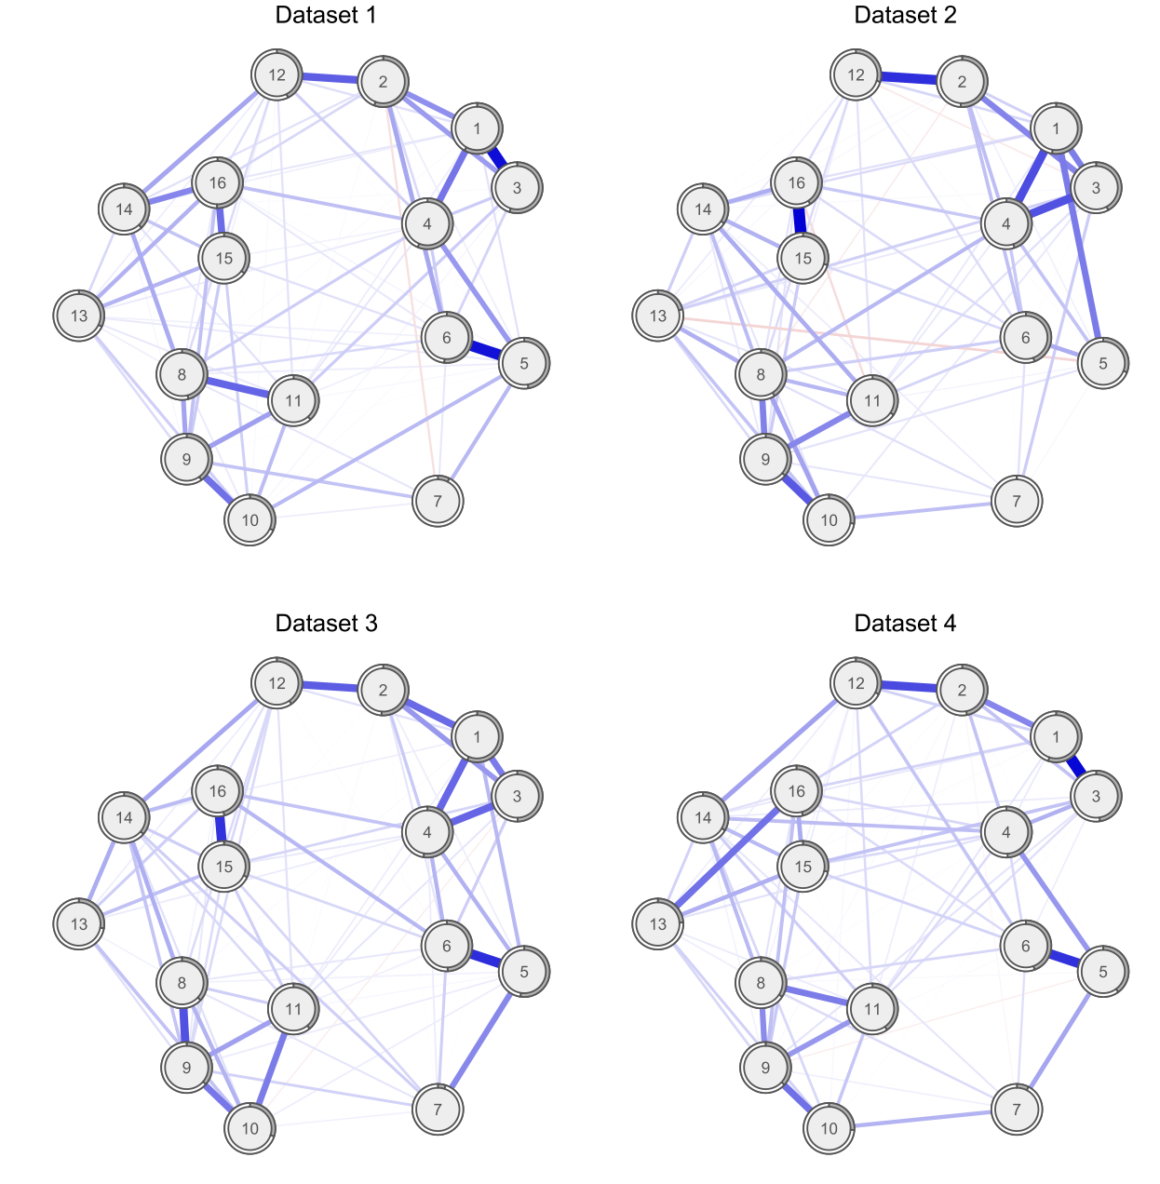
Fried et al. 2017
Our paper entitled “Replicability and generalizability of PTSD networks: A cross-cultural multisite study of PTSD symptoms in four trauma patient samples” was published a few days ago Clinical Psychological Science (PDF). I described the results of the paper in more detail in a previous blog post. In summary, the paper, for the first time in the literature, compared estimated network structures across four different datasets. Specifically, we compared networks of PTSD symptoms across 4 moderate to large clinical datasets of patients receiving treatment for PTSD, and found considerable similarities (and some difference) across network structures, item endorsement levels, and centrality indices. See the paper & blog post for details.
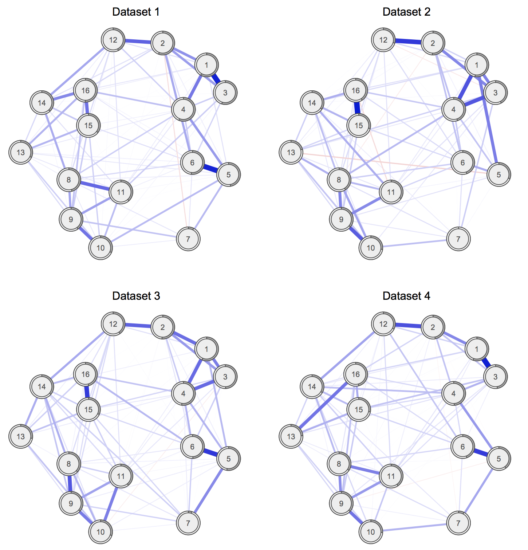
» Fried, E. I., Eidhof, M. B., Palic, S., Costantini, G., Huisman-van Dijk, H. M., Bockting, C. L. H., … Karstoft, K. I. (2017). Replicability and generalizability of PTSD networks: A cross-cultural multisite study of PTSD symptoms in four trauma patient samples. Clinical Psychological Science. PDF.
Kendler et al. 2017
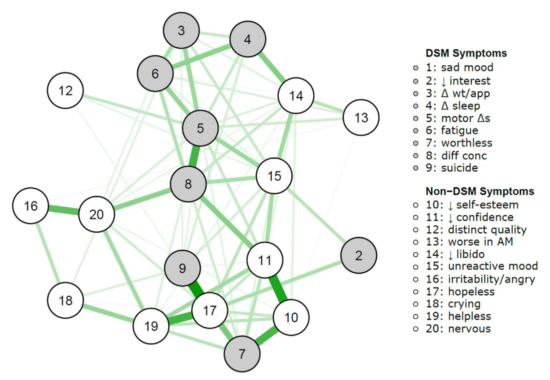
It is well known that depressed patients suffer from numerous symptoms that go beyond the DSM criteria for Major Depression, such as anger, irritability, or anxiety. In 2016, we investigated1 whether DSM symptoms are more central than non-DSM symptoms in a large clinical population, and found that this was not the case.
Kendler et al. 2017 published a paper last week in the Journal of Affective Disorders that is a conceptual replication of this previous paper, in a different very large clinical sample of highly depressed Han Chinese women (the CONVERGE data); conceptual replication because the population in CONVERGE differs considerably from the STAR*D data from the first paper, and because item content also differed.
The results are the same: DSM symptoms were not more central than non-DSM symptoms.
This means that there is nothing special in terms of network psychometrics about DSM symptoms for depression compared to non-DSM symptoms. Which makes sense, given that the DSM symptoms were chosen largely for historic and not empirical, scientific, or psychometric reasons2.
» The Centrality of DSM and non-DSM Depressive Symptoms in Han Chinese Women with Major Depression (2017). Kendler, K. S., Aggen, S. H., Flint, J., Borsboom, D., & Fried, E.I. Journal of Affective Disorders. PDF.
van Loo et al. 2017
In another paper published in the same journal, van Loo et al. divided the CONVERGE sample mentioned above into 8 subgroups based on 4 variables of genetic and environmental risk: family history (present vs absent), polygenic risk score (low vs high), early vs. late age at onset, and severe adversity3 (present vs present).
The network structures did not significantly differ across these 4 variables4.
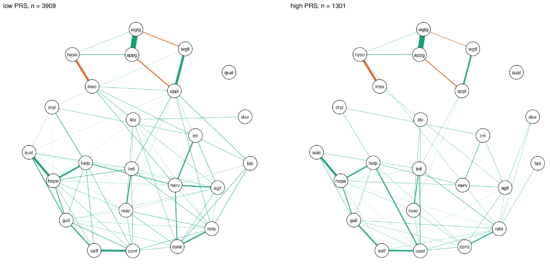
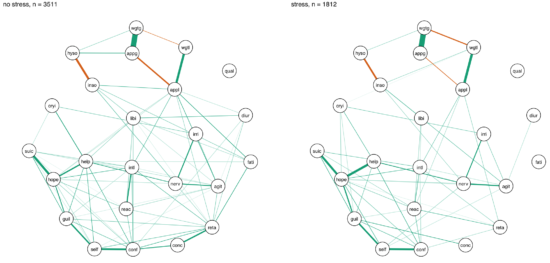
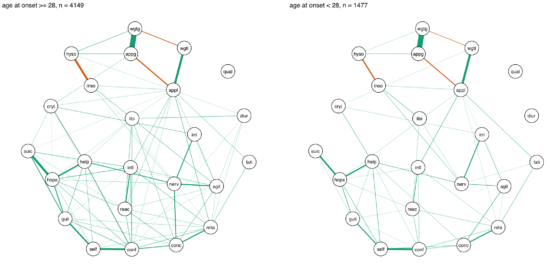
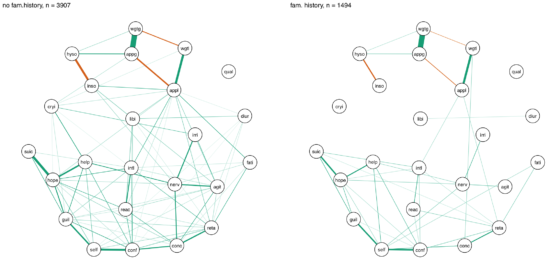
I was surprised by these remarkable similarities across different subgroups, which (contrasting my own work) could be interpreted in the sense of one common pathway to depression. Then again, CONVERGE is a very specific sample, with recurrent severe symptomatology, and I’m looking forward to see replication attempts of these results in less severely depressed samples.
» van Loo, H.M., van Borkulo, C. D., Peterson, R.E., Fried, E.I., Aggen, S.H., Borsboom, D., Kendler, K.S. (2017). Robust symptom networks in recurrent major depression across different levels of genetic and environmental risk. Journal of Affective Disorders. PDF.
Forbes et al. 2017 / Borsboom et al. 2017
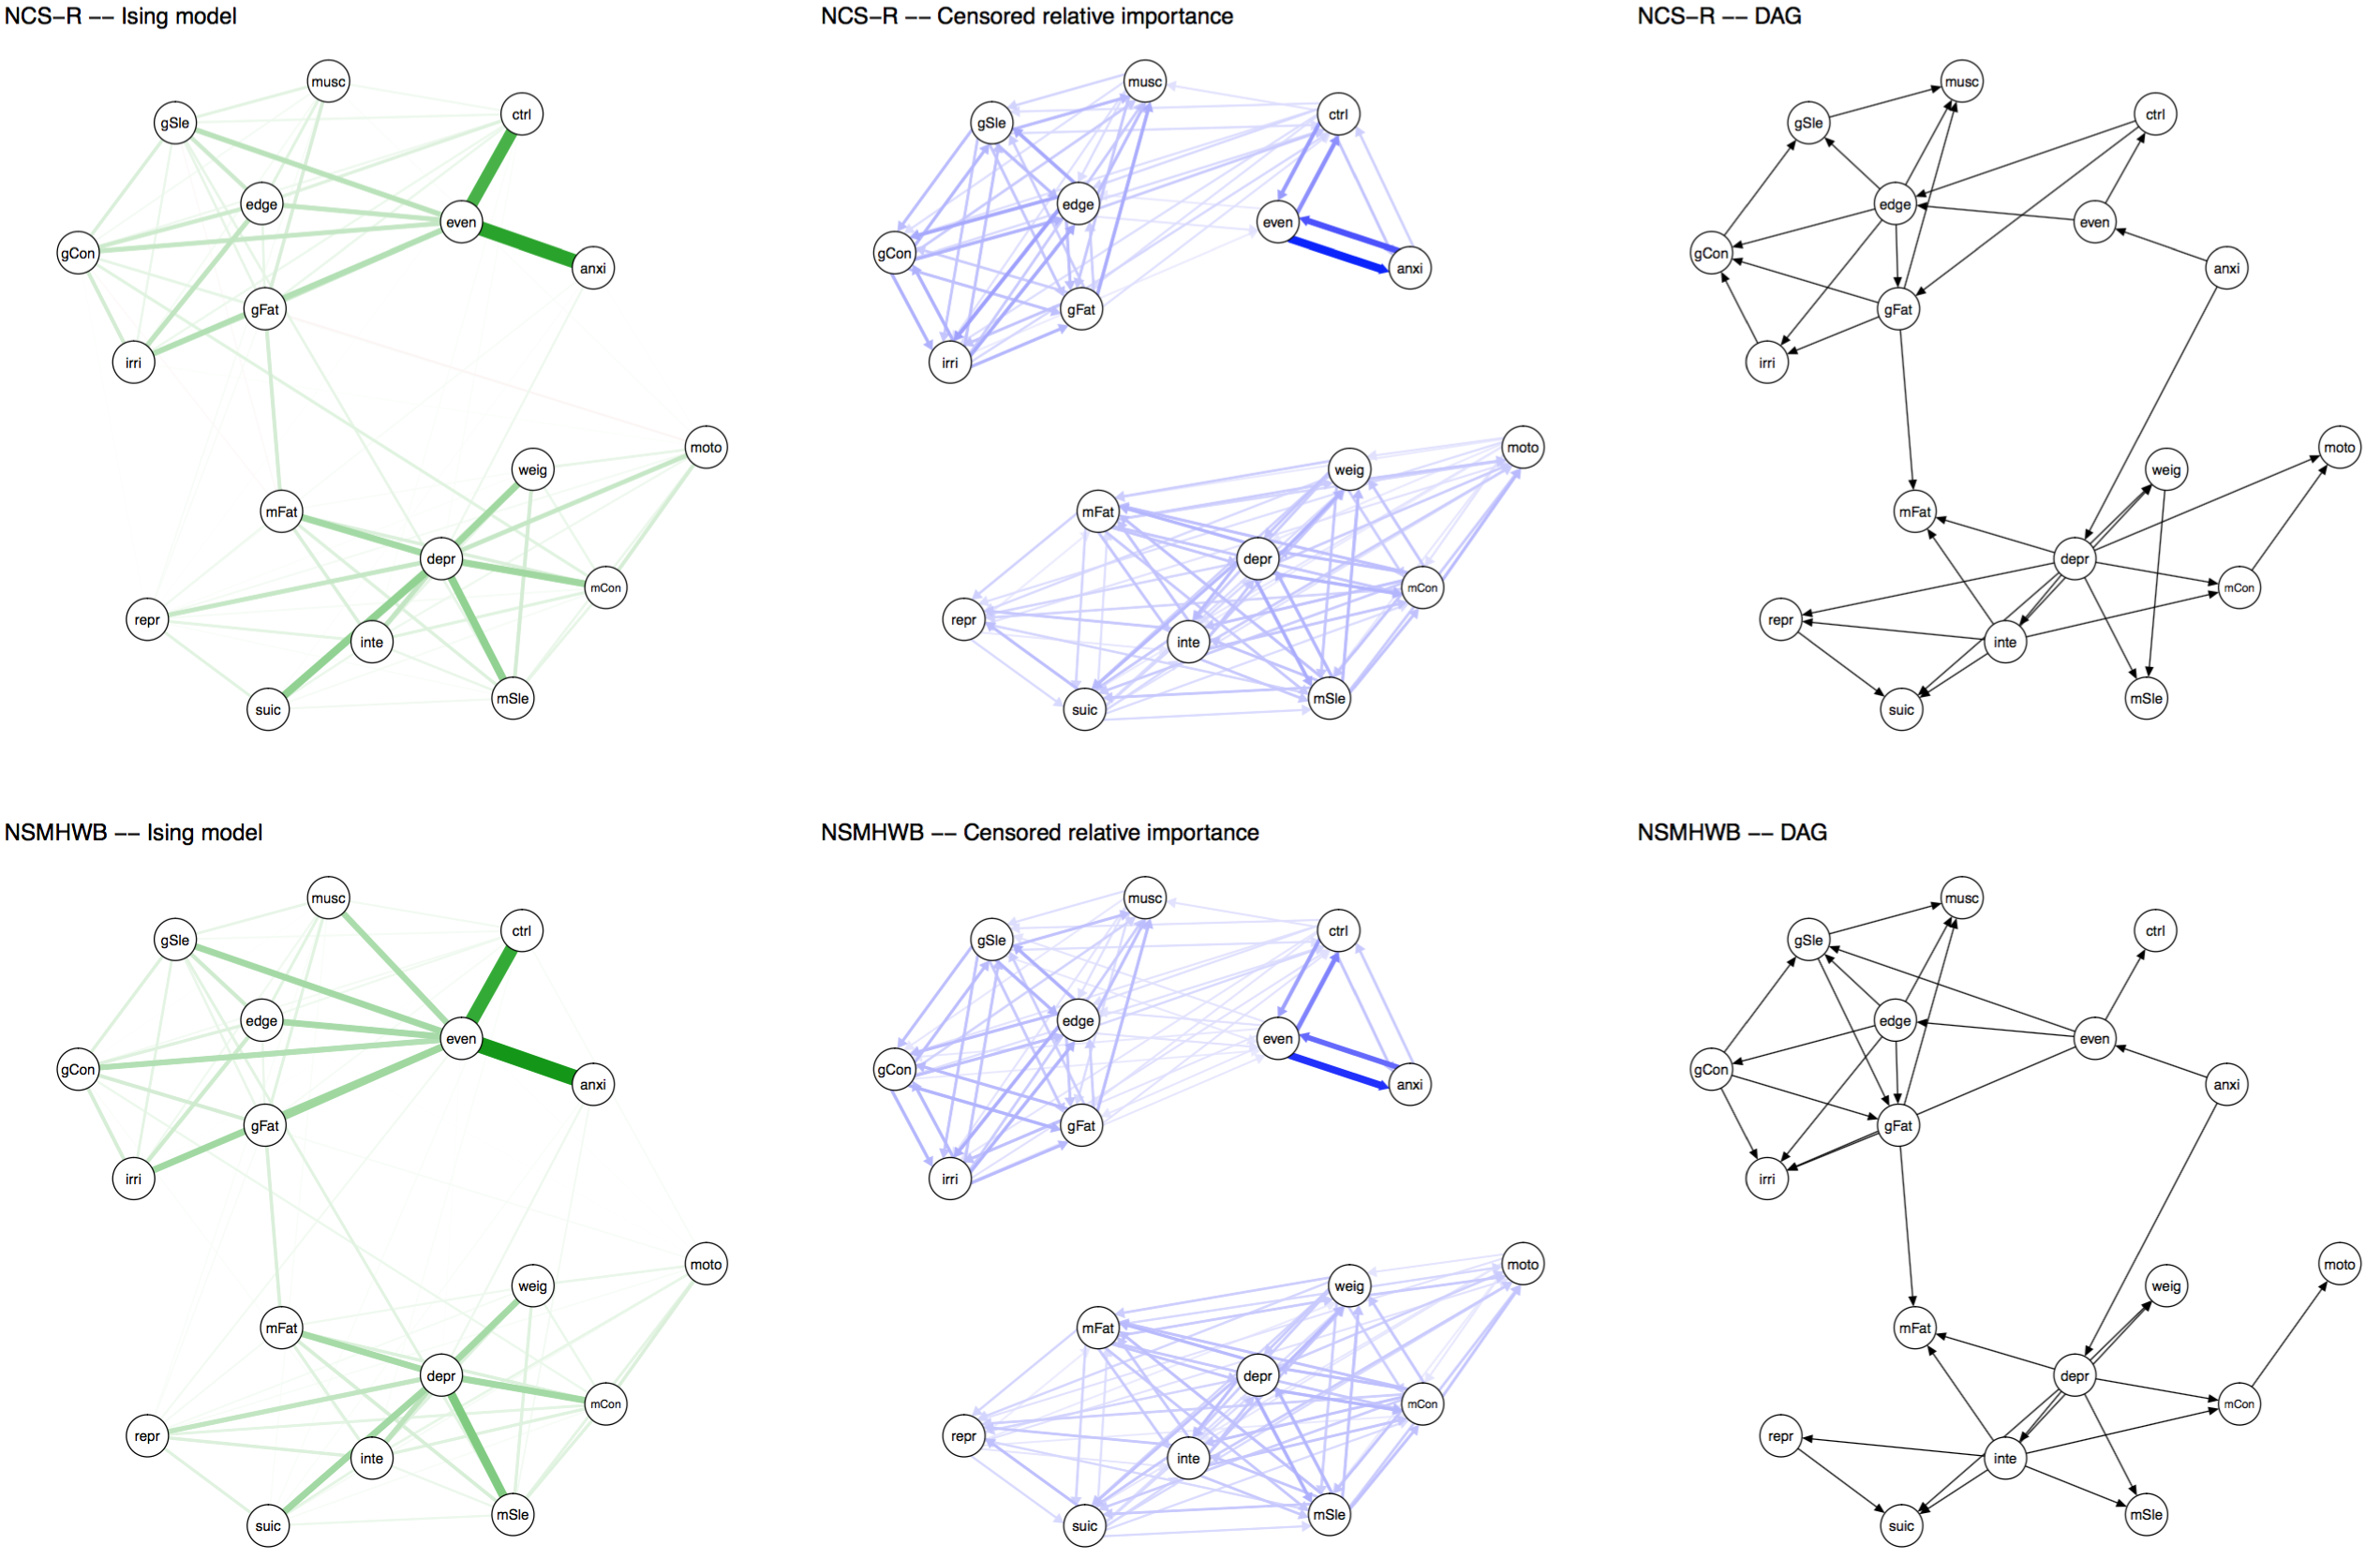
I have covered the paper by Forbes et al. and the rebuttal by Borsboom et al. published in the Journal of Abnormal Psychology in detail already in a recent blog, and will refrain from reiterating the points here. In sum, both papers investigated the degree to which several network models replicate across 2 very large community datasets, with the following results:
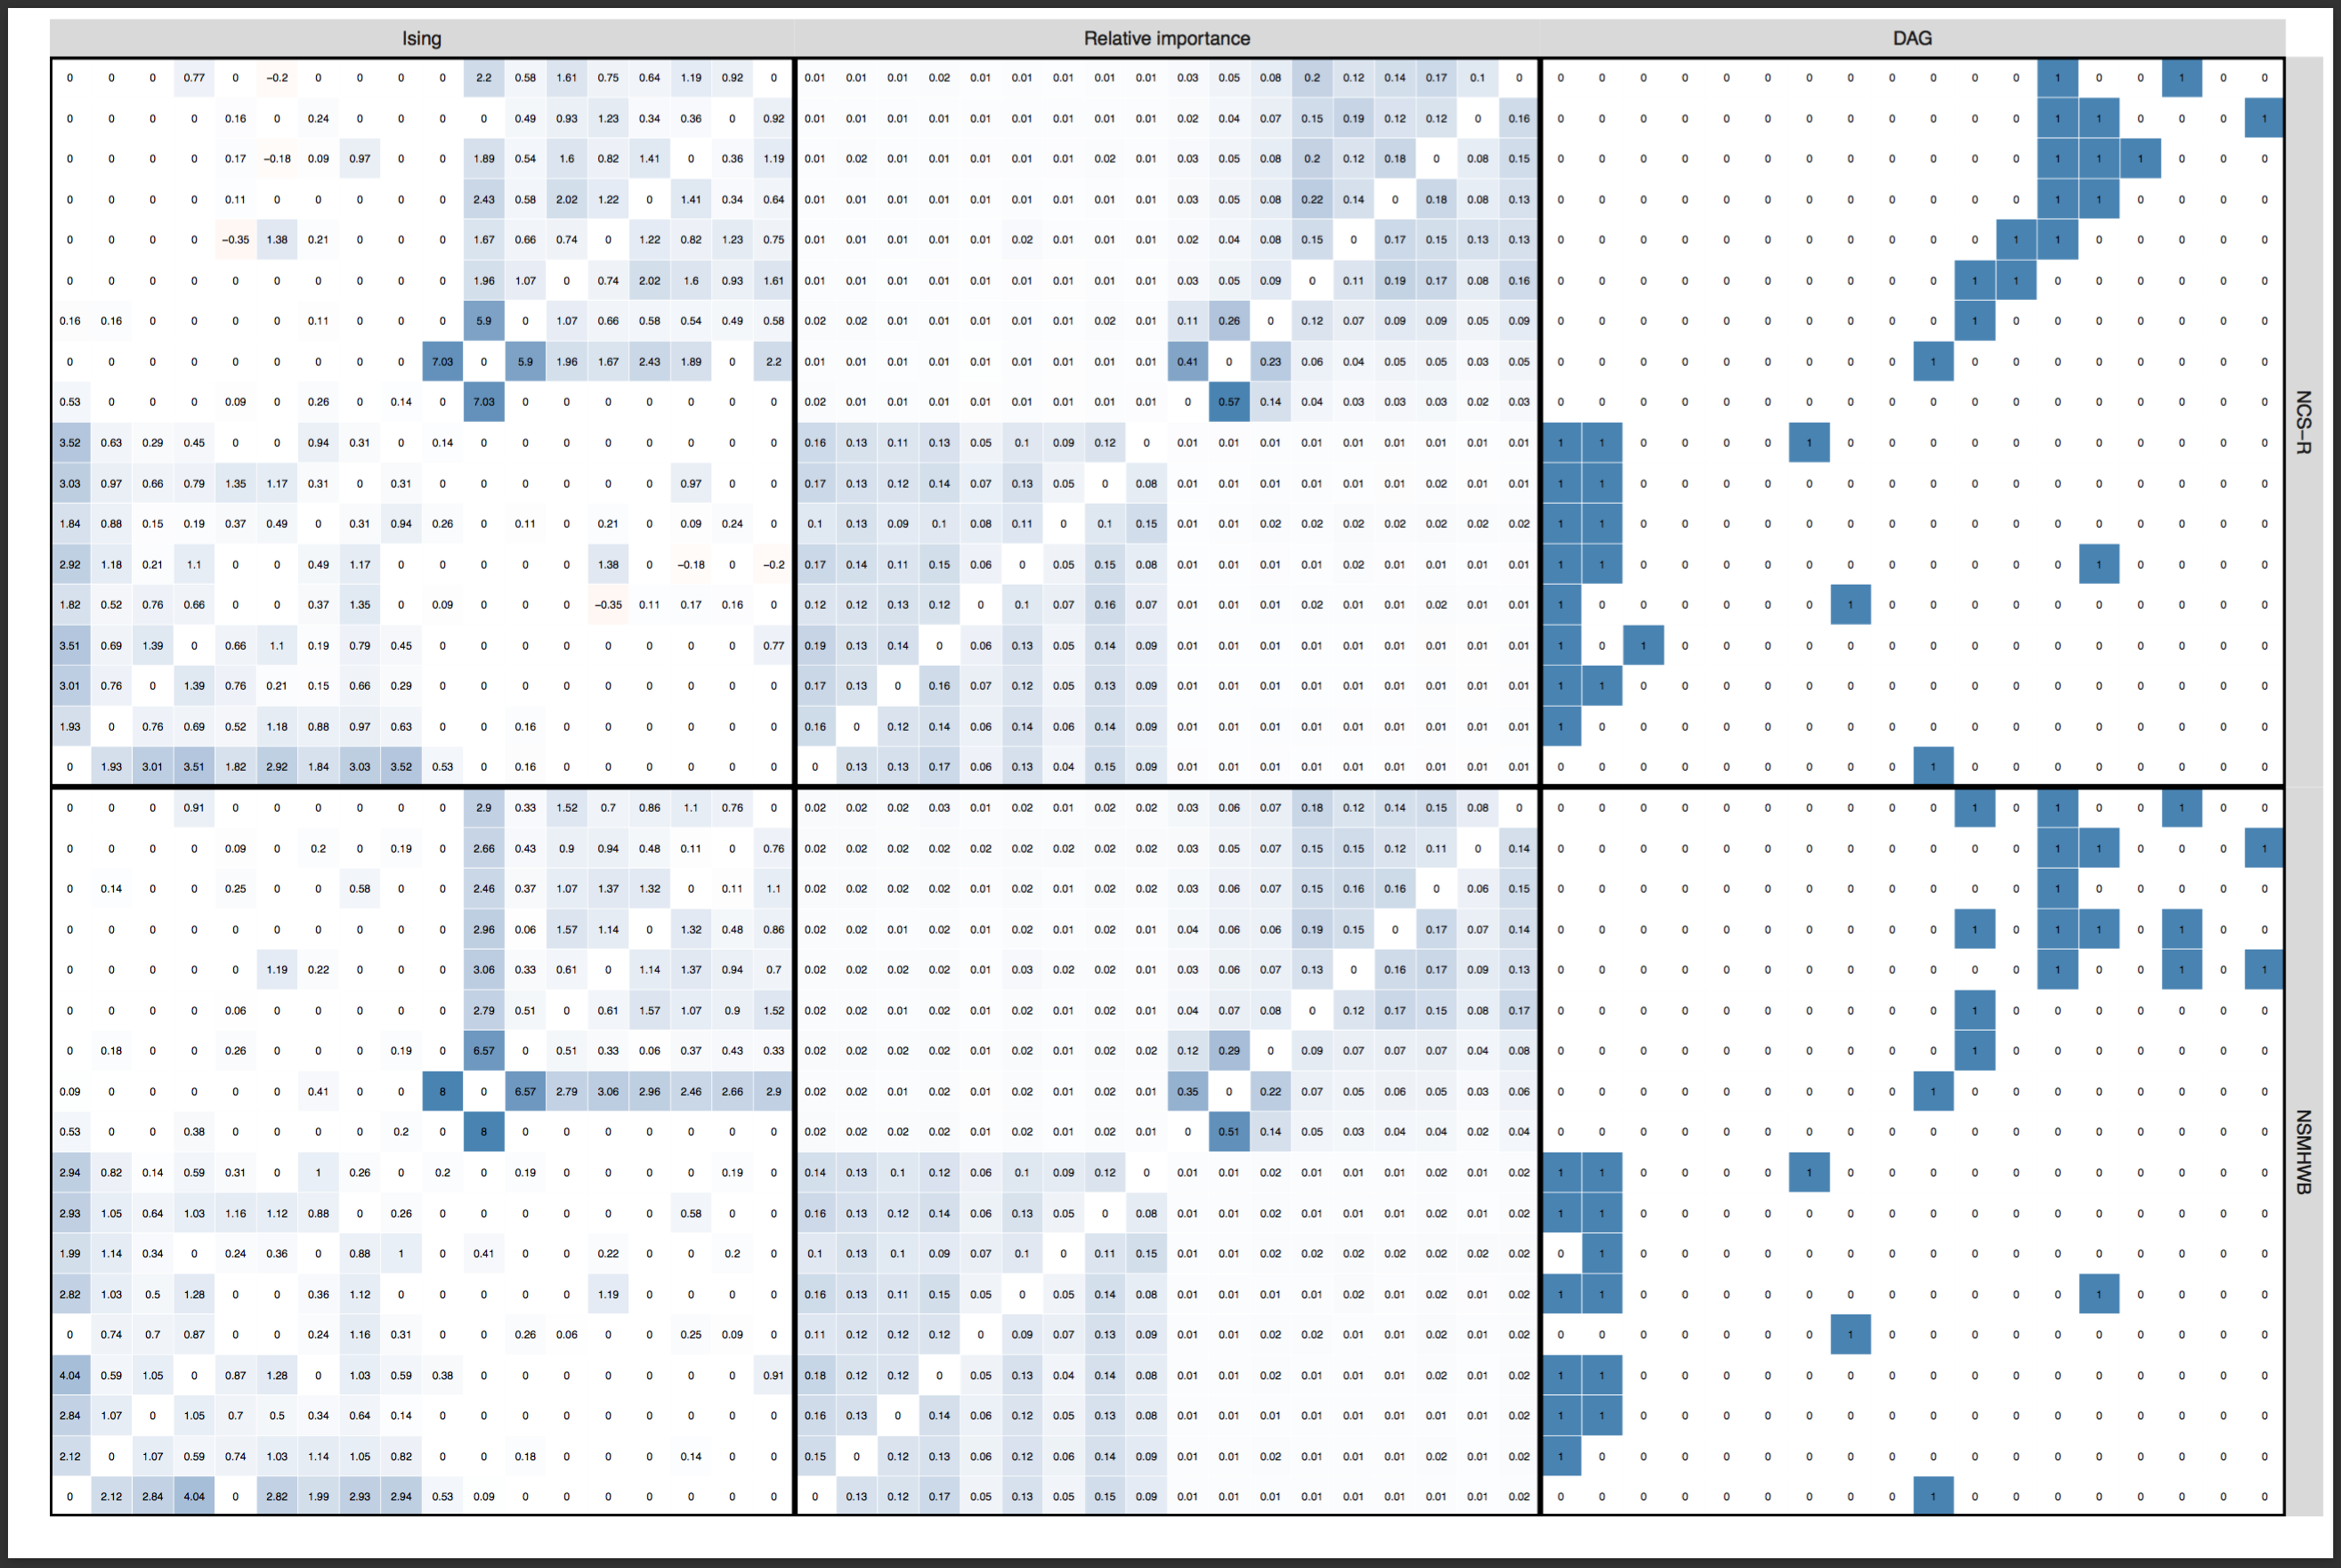
And here the edge weights as a heat map to stress how strong the replication is5:
» Forbes, M. K., Wright, A. G. C., Markon, K. E., & Krueger, R. F. (2017). Evidence that Psychopathology Symptom Networks have Limited Replicability. Journal of Abnormal Psychology, 126(7). PDF.
» Borsboom, D., Fried, E. I., Epskamp, S., Waldorp, L. J., van Borkulo, C. D., van der Maas, H. L. J., & Cramer, A. O. J. (2017). False alarm? A comprehensive reanalysis of “evidence that psychopathology symptom networks have limited replicability” by Forbes, Wright, Markon, and Krueger (2017). Journal of Abnormal Psychology, 126(7). PDF.
There was considerable disagreement among the 2 teams of authors whether these network structures replicate across the datasets. Both teams agreed, however, that readers should decide for themselves by reading both papers.
Schweren et al. 2017
A letter published in JAMA Psychiatry last week is a non-replication of a prior finding by van Borkulo et al. 20156. I described the paper in a previous blog in more detail, the relevant point here is: Schweren et al. 2017 split a sample into two subgroups at time 2 (treatment responders and non-responders), and then compared the time 1 networks of these two groups for connectivity (i.e. the sum of all absolute connections in the network structures). Contrasting van Borkulo et al. 2015, Schweren et al. found no significant differences across the groups. Or if you put it differently: networks replicated across the subgroups, not dissimilar to the paper by van Loo et al. 2017 above. Again, we need follow-up work on this, since the effect was in the direction predicted by van Borkulo et al. 2015, and since the statistical test used requires a lot of power to detect differences.
» Schweren, L., van Borkulo, C. D., Fried, E. I., & Goodyer, I. M. (2017). Assessment of Symptom Network Density as a Prognostic Marker of Treatment Response in Adolescent Depression. JAMA Psychiatry, 1–3. PDF.
Jones et al. 2017
In early 2017, Psychological Medicine published a network analysis of OCD and depression comorbidity authored by McNally et al., who used network models to estimate undirected and directed network structures in a cross-sectional sample of 408 adults with primary OCD.
Last week, Jones et al. 2017 published a paper that looked into the network structure of the same OCD and depression items in 87 adolescents. The publication has found a home in the Journal of Anxiety Disorders, and is entitled “A Network Perspective on Comorbid Depression in Adolescents with Obsessive-compulsive Disorder” (PDF).
Interestingly, the authors use the same items in both papers, so Payton Jones wrote a blog post in which he compares the results of both papers. Payton writes that this is not a direct replication — samples differ considerably from each other — but also notes that “the similarities (e.g., the parts that ‘replicate’) are likely to say something universal about how OCD and depression work, and the differences (e.g., the parts that ‘don’t replicate’) might tell us about what makes adults and adolescents unique (or they might be spurious – we’ll have to be careful)”.
I admit that I am surprised the authors obtained a network structure at all in such a small sample — with n=87 for 300 parameters, I would have expected the lasso to put all edges to zero — and I am even more surprised that network structures seem to resemble each other fairly well (the correlation between adjacency matrices is 0.67).
» Payton, J. J., Mair, P., Riemann, B. C., Mungno, B. L., & McNally, R. J. (2017). A Network Perspective on Comorbid Depression in Adolescents with Obsessive-compulsive Disorder. Journal of Anxiety Disorders. PDF.
Two words of caution …
Network comparison
A core component to establishing replicability of findings is to formally compare network structures. One way to find out out whether network structures are different from each other is to use the Network Comparison Test (NCT) developed by Claudia van Borkulo that I described in a bit more detail in the last tutorial blog post. However, the NCT requires a lot of power to detect differences, so a negative result (p > 0.05) can mean (a) that there is no difference between networks, or (b) that you do not have sufficient power to detect differences. Note also that the NCT uses Pearson correlations by default, and there are many situations in which Pearson is not appropriate for your data.
Therefore, we might want to complement the investigation of differences (e.g. via the NCT) with an estimate of the similarity of networks. One way to do that is to look at all individual edges via the NCT, and report how many of these are not different from each other. We did that in the above reference Clinical Psych Science paper, where we compared each pair of the 4 networks with each other:
“Of all 120 edges for each comparison of networks, only 2 edges (1.7%; comparison networks 1 vs. 2 and 1 vs. 4) to 8 edges (6.7%; comparison networks 3 vs. 4) differed significantly across the networks, with a mean of significantly different edges across the 6 comparisons of 3.1 edges.
That means that while, for instance, networks 1 and 2 differed significantly from each other in the omnibus NCT (not shown; i.e. structure is not exactly the same), only 1.7% of all 120 edges of networks 1 and 2 differed significantly from each other in the posthoc tests — giving us a measure of similarity7.
But the most common metric for similarity of two networks in the literature is to estimate a correlation coefficient between two adjacency matrices. Since we usually compare regularized network structures — with sparse adjacency matrices where many elements are exact zero — correlations might not be the best idea here, and it would be nice to run a simulation study to see what happens exactly, under which cases. I’ve used correlation coefficients as well, in several papers, because I think it offers some very rough insight, but I wanted to highlight here that this is probably not the best way to move forward.
Time-series replications
Another topic that deserves more attention is replicability of findings in time-series studies. For instance, Madeline Pe8 wrote a great paper showing that the connectivity of the temporal network structure a depressed sample is higher than that of a healthy sample, and I’m not aware of replications of this finding. There is one group-level9 and one idiographic paper10 on critical slowing down, and I’m very curious to what degree these phenomena will replicate on other data. And then of course there are many papers fitting exploratory models to time-series data, and I am looking forward to seeing to which degree these models replicate in similar datasets. Such data-gathering and modeling efforts will also allow us the question to which degree intra-individual network structures of individuals (e.g. depressed patients) are similar to each other. Preliminary evidence11 suggests that there are marked differences.
Footnotes
- Fried, E. I., Epskamp, S., Nesse, R. M., Tuerlinckx, F., & Borsboom, D. (2016). What are “good” depression symptoms? Comparing the centrality of DSM and non-DSM symptoms of depression in a network analysis. Journal of Affective Disorders, 189, 314–320. http://doi.org/10.1016/j.jad.2015.09.005.
- Kendler, K. S. (2016). The Phenomenology of Major Depression and the Representativeness and Nature of DSM Criteria. American Journal of Psychiatry, appi.ajp.2016.1. http://doi.org/10.1176/appi.ajp.2016.15121509
- Based on a combination of childhood sexual abuse and stressful life events.
- The authors established this using the Network Comparison Test, a psychometric test that investigates whether network structures differ.
- Heatmaps created by Sacha Epskamp.
- van Borkulo, C. D., Boschloo, L., Borsboom, D., Penninx, B. W. J. H., Waldorp, L. J., & Schoevers, R. A. (2015). Association of Symptom Network Structure With the Course of Longitudinal Depression. JAMA Psychiatry, 72(12), 1219. http://doi.org/10.1001/jamapsychiatry.2015.2079
- Note that the default setting when testing all edges is using the very conservative Bonferroni correction; it is an open question whether this is a too conservative setting, and work is on the way to relax this correction in future updates of the package.
- Pe, M. L., Kircanski, K., Thompson, R. J., Bringmann, L. F., Tuerlinckx, F., Mestdagh, M., … Gotlib, I. H. (2015). Emotion-Network Density in Major Depressive Disorder. Clinical Psychological Science, 3(2), 292–300. http://doi.org/10.1177/2167702614540645
- van de Leemput, I. A., Wichers, M., Cramer, A. O. J., Borsboom, D., Tuerlinckx, F., Kuppens, P., … Scheffer, M. (2014). Critical slowing down as early warning for the onset and termination of depression. Proceedings of the National Academy of Sciences of the United States of America, 111(1), 87–92. http://doi.org/10.1073/pnas.1312114110
- Wichers, M., Groot, P. C., Psychosystems, ESM Group, & EWS Group. (2016). Critical Slowing Down as a Personalized Early Warning Signal for Depression. Psychotherapy and Psychosomatics, 85, 114–116. http://doi.org/10.1159/000441458
- Fisher, A. J., Reeves, J. W., Medaglia, J. D., & Rubel, J. A. (2017). Exploring the Idiographic Dynamics of Mood and Anxiety via Network Analysis. Journal of Abnormal Psychology, 126(8), 1044–1056. http://doi.org/http://dx.doi.org/10.1037/abn0000311.
Pingback: (Mis)interpreting Networks: An Abbreviated Tutorial on Visualizations | Psych Networks
Hi:
I have developed a method to assess differences between two precision matrices. I looked at the first work here, and noted only one of the data sets were provided. Do you know of two data sets that are available, where the claim was the networks were not different.
Thanks
Sorry Donny, this was marked as spam and I didn’t see it before. Feel free to reach out via email if you need more information.