
This guest blog post was written by Sacha Epskamp, Assistant Professor at the University of Amsterdam. It does not necessarily reflect the opinions of other authors on the paper introduced below.
The methodological journal Multivariate Behavioral Research just published our latest contribution to the debate surrounding the replicability of psychological networks (the pre-print and codes were already available on OSF). To recap, last year, the Journal of Abnormal Psychology published a series of four papers:
- A paper claiming networks have limited replicability (Forbes, Wright, Markon, & Krueger, 2017a)
- Our commentary on this paper showing the networks to replicate well in a comprehensive re-analysis1(Borsboom et al., 2017)
- A commentary by Steinley, Hoffman, Brusco, & Sher (2017) introducing a new method and claiming networks do not differ from what is expected by chance, supporting arguments of Forbes et al.
- And a rebuttal of the original authors (Forbes, Wright, Markon, & Krueger, 2017b), relying on the work by Steinley et al. (2017) as well as a literature review in PTSD networks to present further evidence that networks have limited replicability.
Papers 1, 2, and in some extent 4 have already extensively been discussed online, and I will not discuss them in detail again here. The Psychosystems group posted a short statement on its blog, Eiko posted a longer blog on the whole process, and I posted a public post-publication peer review on pubpeer (the original authors responded to these, so make sure to read their comments as well as ours to get a fair and balanced overview). We mentioned working on a (critical) commentary on paper 3 in these discussions as well.
In an unprecedented display of scientific integrity, Douglas Steinley himself invited us in response to submit this commentary to the prestigious methodological journal Multivariate Behavioral Research instead of the Journal of Abnormal Psychology, which we happily accepted. This brings me to the topic at hand. In this blog post, I will summarize the two main points of our commentary, showing that the conclusions made in paper 3 are unwarranted. Next, I will showcase an example not discussed in our commentary, in which the proposed methodology has strong utility, by re-analyzing a 10-year old network of the DSM-IV-TR.
Fixed-margin sampling in network psychometrics
The commentary by Steinley et al. (2017) (paper 3) introduces a new method for creating “confidence intervals” from network parameters and descriptives. We term this method “fixed-margin sampling” as it entails generating new random binary datasets while keeping the margins (row and column totals) intact. These sampled datasets can subsequently be used to create intervals for any statistic. Using this method, the authors conclude that “many of the results are indistinguishable from what would be expected by chance”, labeling such findings “uninteresting”, and suggesting that “previously published findings using [eLasso] should be reevaluated using the above testing procedure.” Forbes et al. (2017b) re-iterate the last statement in paper 4: “this finding highlights the central role that Steinley et al.’s (2017) proposed method should have in psychopathology network research going forward.”
In our new commentary in Multivariate Behavioral Research, we show that the work of Steinley et al. (2017) relies on a misinterpretation of psychological networks. The crux of the matter lies in this paragraph:
“Clearly, psychopathology networks fall into the class of affiliation matrices where the connections are measured between observation and diagnostic criteria. The relationships between the criteria are then then derived by transforming the two-mode affiliation matrix to a one-mode so-called “overlap/similarity” matrix between the criteria, where traditional network methods are applied to this overlap/ similarity matrix.”
Steinley et al. (2017) interpret Ising models used in psychology as one-mode projections of so-called two-mode or bipartite graphs. That means that they interpret a standard person by symptom data matrix:
| Depressed mood | Fatigue | |
| Bob | 1 | 1 |
| Alice | 1 | 0 |
To actually encode a network:
Depressed mood — Bob — Fatigue — Alice
Of which the symptom by symptom network is a so-called projection:
Depressed mood – Fatigue
That is, depressed mood and fatigue interact with one-another because they share one person: Bob. Similarly, Bob and Alice interact with one-another because they share one symptom: fatigue. But this is not the intention of the Ising model, which is a model for conditional independencies. In fact, one core assumption in many multivariate statistical models is that the cases (Bob and Alice) are independent, which means they do not interact with one-another because they share a symptom. The symptom fatigue is also a different property of Alice and Bob, and not an entity in the world they both interact with.
While keeping the column totals intact has little to no effect in generating such data, keeping the row totals (in this case: number of symptoms per person) intact has a striking effect; it leads to highly one-dimensional models used as null-distribution:

This means that due to latent variable – network equivalences, fixed-margin sampling takes a fully connected network model as null-distribution to test estimated network models. Such a procedure will lead to false conclusions on the importance of estimated network parameters. We show in our commentary that the method performs poorly in classifying true effects as interesting and false effects as uninteresting.
Fixed-margin sampling to assess unidimensionality
Fixed-margin sampling generates data under a particular kind of unidimensionality: a model in which each item is interchangeable (Verhelst, 2008). Such a model is also known as the Rasch model. As the DSM classification of disorders typically treats symptoms as interchangeable, it is interesting to see how well combining fixed-margin sampling with the eLasso Ising estimation method performs as a non-parametric test for the Rasch model. This may be worthwhile, as it would give us insight in where the data diverge from the Rasch model and thus alternative explanations are warranted (although not required). We investigated this in two simulation studies. In one simulation study, we simulated data under the following model:
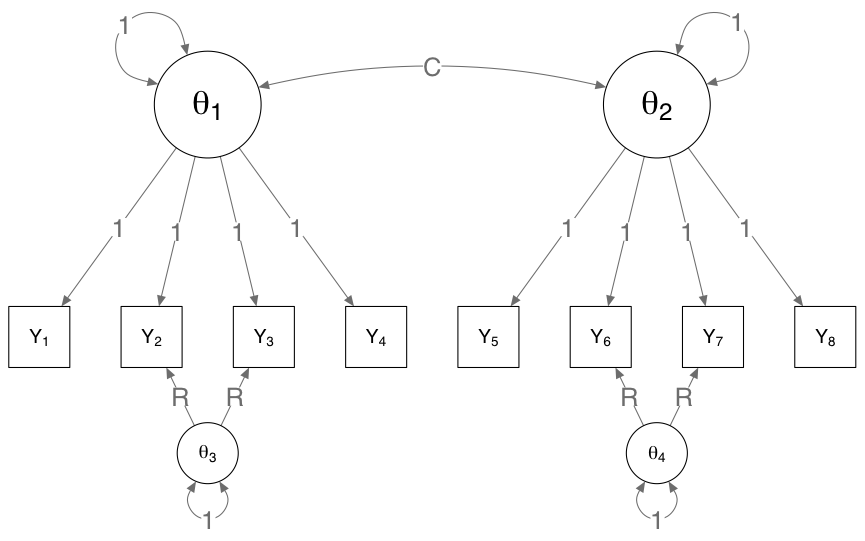
By varying the C parameter (correlation between factors), we can change the model from two independent variables (C = 0) to one latent variable (C = 1), and by increasing the R parameter (residual effect), we can add two violations of the one- or two-factor model. The results are as followed:

The colored areas in the background show the probability to flag the edges related to parameter R as not being in line with the Rasch model. It shows that the method works very well in detecting these local violations of the Rasch model. The boxplots show global departures and should be high if all edges are flagged as departures from the Rasch model. This should be the case in the C = 0 condition but doesn’t happen often. This shows that while this method is powerful in detecting local departures from the Rasch model, it is far less powerful in detecting global departures form the Rasch model. As such, I would recommend using this method to gain insight in where unidimensionality does not hold, but not to use it as a test for the Rasch model itself by counting the number of flagged edges.
Fixed-margin sampling in network science
While fixed-margin sampling should not be used to assess psychometric networks that are based on estimating statistical models from large sample sizes of independent cases (e.g., the Ising model), the method has strong utility in the analysis of one-mode network structures that are derived from bipartite graphs. One such a network is actually the first network I ever constructed and analyzed: the DSM-IV-TR network (Borsboom, Cramer, Schmittmann, Epskamp, & Waldorp, 2011):
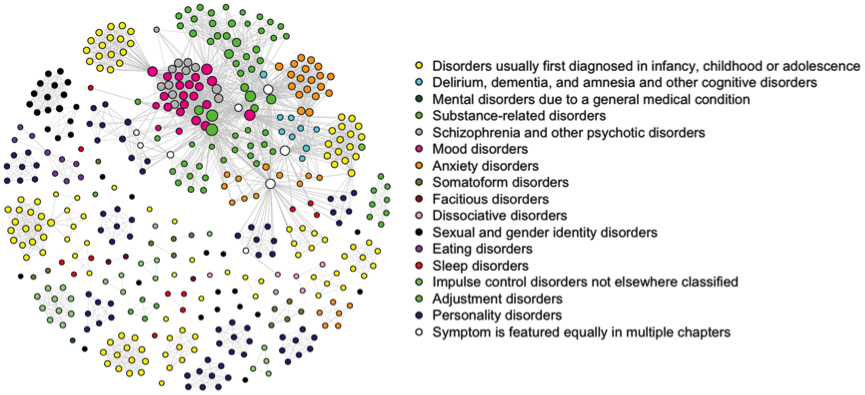
I worked on this network about 10 years ago as an undergraduate student, long before we even entertained the notion of estimating network models from data. All the codes and data used for the network visualizations are still online. To create this network, we created an affiliation matrix of 439 symptoms by 148 disorders, encoding if a symptom was listed as a symptom of a disorder in the DSM-IV-TR. The data simply is a 439 row and 148 column matrix with 0 indicating a symptom is not listed in a disorder and 1 indicating a symptom is listed in a disorder. This dataset can subsequently be transformed to a 439 by 439 adjacency matrix encoding if symptoms are both listed in at least one shared disorder by multiplying the data with it’s transpose and making every non-zero element one2.
While the dataset used for this network looks similar to a dataset you may use when estimating an Ising model (zeroes and ones), it is actually a very different kind of data. In an Ising model, the more cases we add the more precise our estimates of the network model: if we double the sample size from 10.000 to 20.000 we would not expect a completely different model, merely to be able to estimate the parameters even more precise. In the DSM-IV-TR affiliation matrix, however, this is not the case: doubling the number of symptoms listed will fundamentally change the interpretation of the model (doubling the number of nodes), and doubling the number of disorders listed will fundamentally change the structure of the network. We also cannot do this, as we already listed all symptoms and disorders from the DSM-IV-TR. Rather than columns representing random stochastic variables and rows representing independent realizations, the columns and rows both represent simply static entities: words in a book. The network structure is simply a description of this book, and equivalent to adding more cases would be to test more books (e.g., Tio, Epskamp, Noordhof, & Borsboom, 2016).
This means we also cannot bootstrap the dataset, as resampling symptoms with replacement or dropping symptoms hardly makes sense. So what can we do? The fixed-margin sampling method described by Steinley et al. (2017) actually gives a very nice new tool to investigating such structures. Given that some symptoms are listed in many disorders (e.g., insomnia is listed in 17 disorders), and some disorders feature many symptoms (e.g., Schizoaffective Disorder lists 33 symptoms), we would expect certain levels of connectivity by chance alone. If that is the case, the network structure itself is not very interesting, and investigating the symptom and disorder sum totals would be sufficient by itself.
I re-investigated the dataset using fixed-margin sampling and constructed 1,000 networks (codes available here). These are three random samples of the generated networks:
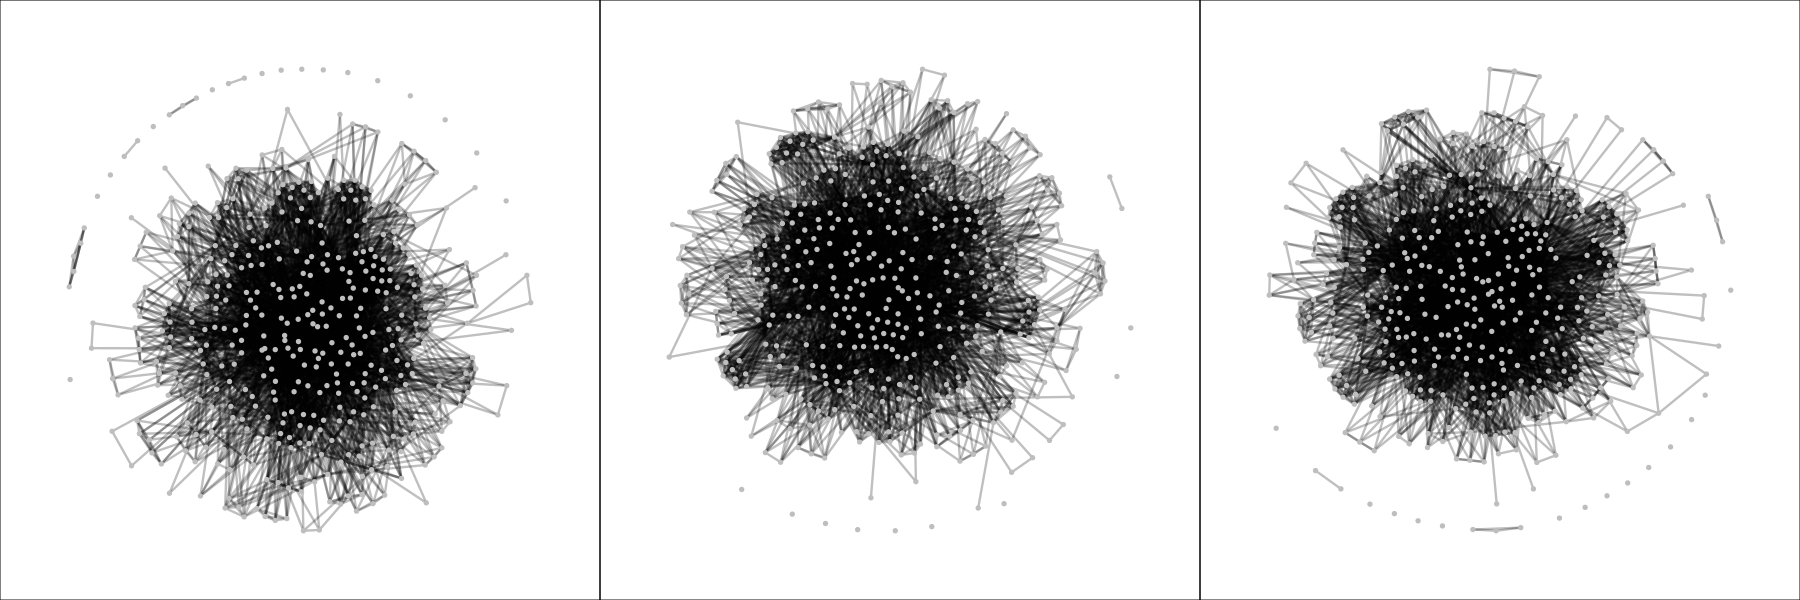
In this case, there is no need for any quantitative analysis and the plots themselves already reveal a remarkable difference between the networks expected by chance alone and the network observed in the DSM-IV-TR: the fixed-margin sampling networks are far denser (more edges) and interconnected. This means that we can conclude that there is structure in the DSM-IV-TR, and symptoms are not randomly assigned to disorders. Of course, there is a structure in the DSM-IV-R imposed by the chapters alone (e.g., mood disorders, personality disorders, etcetera). A follow-up analysis could be to split up the data per chapter, apply fixed-margin sampling to each block, and subsequently combine the data again. Three snapshots of these networks are as follows:
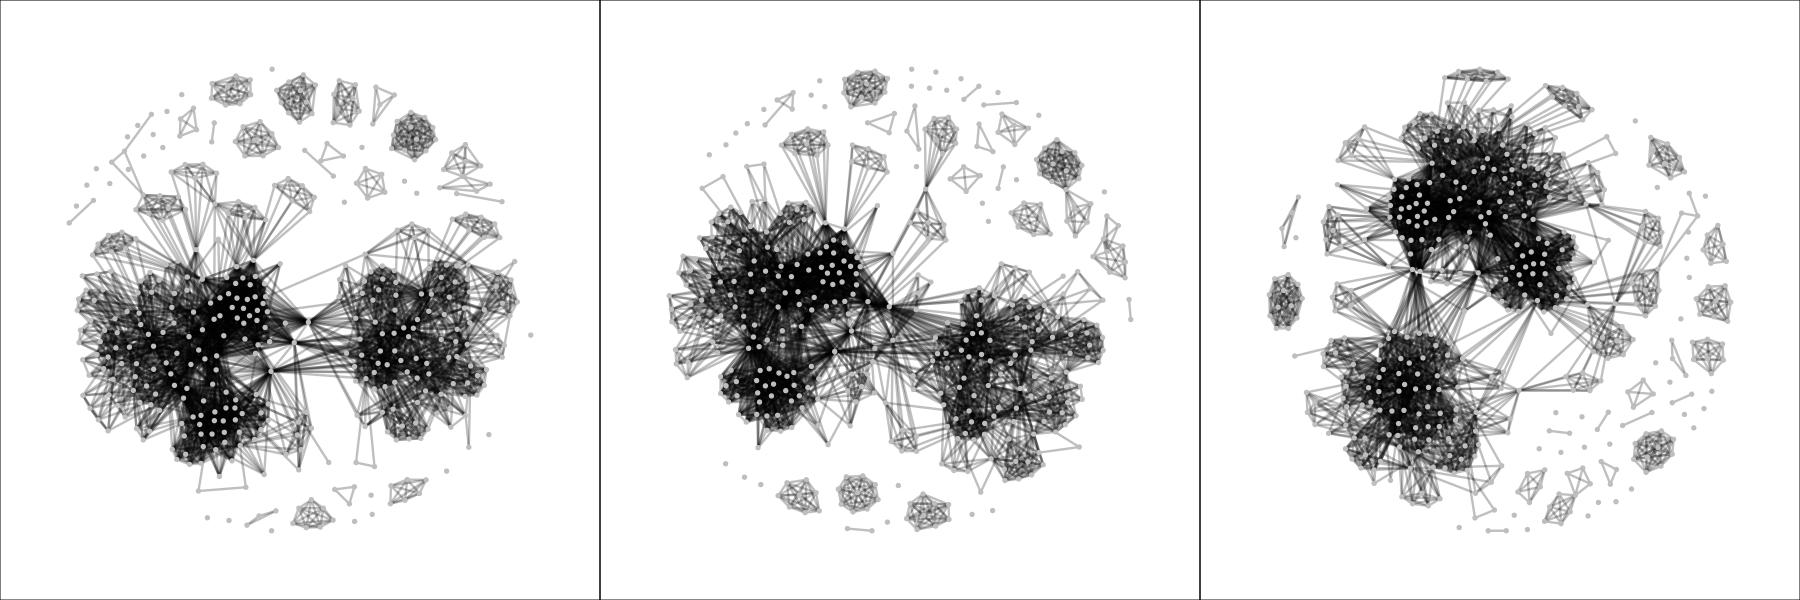
These look much more similar to the observed DSM-IV-TR network, which means that the clustering per chapters already explains a lot of the structure. However, these networks are still denser (number of edges ranging from 3,513 to 3,674, compared to 2,626 in the observed network), meaning that investigating the graph structure is still interesting. When looking at strength centrality, we can see that in the high ranges of strength centrality the observed node strengths are less than could be expected by chance: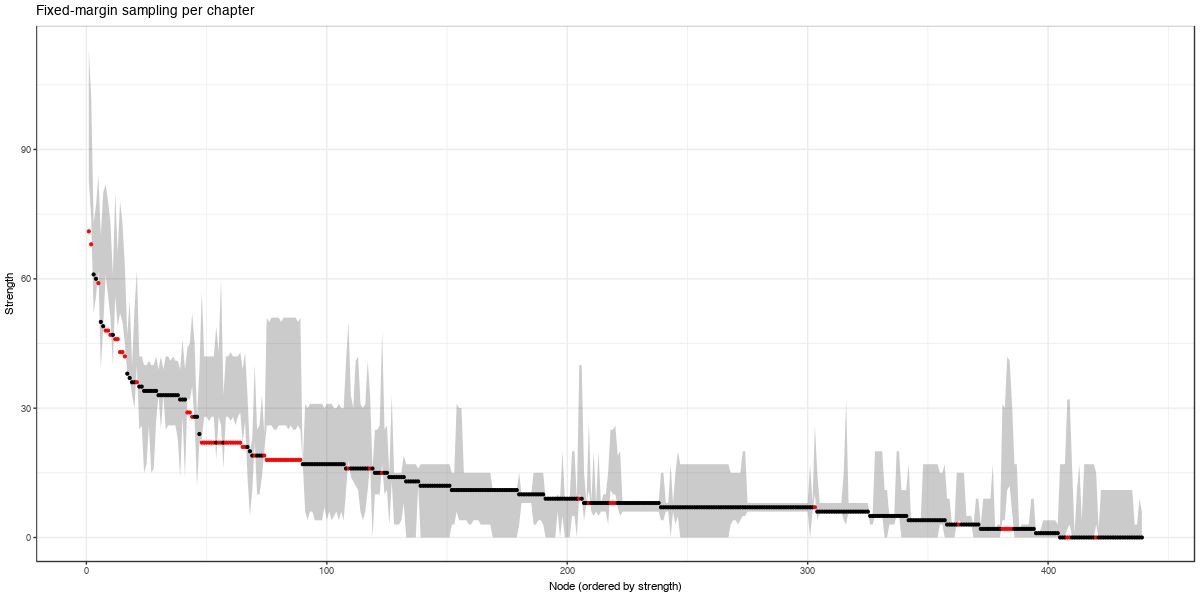
Here, red dots indicate nodes with a strength that was not in the expected interval by fixed-margin sampling.
Conclusion
To conclude, our new manuscript shows that the fixed-margin sampling routine proposed by Steinley et al. (2017) should not be used to evaluate psychometric network models, but shows promise in detecting local departures from Rasch models. Furthermore, the method of fixed-margin sampling is highly valuable in analyzing typical network structures that are constructed rather than estimated. I think that the combination of our commentary in the Journal of Abnormal psychology last year (Borsboom et al., 2017) and the new commentary discussed in this blog post safely put most criticism raised in last years series of papers to rest, and I look forward moving this discussion further in discussing crucial challenges network analysis faces in the coming years, of which there are many (see, e.g., comment # 5 on the pubpeer discussion, several publications on challenges to network analysis, and continued debate on the interpretation of networks).
If you would like to study fixed-margin sampling yourself, all codes for our simulations are available on the Open Science Framework. These rely on both R and Matlab, however, to fully replicate the analysis as proposed by Steinley et al. (2017). For R-based alternatives, the R packages RaschSampler and vegan should have similar performance.
References
Borsboom, D., Cramer, A. O. J., Schmittmann, V. D., Epskamp, S., & Waldorp, L. J. (2011). The Small World of Psychopathology. PLoS ONE, 6(11), e27407.
Borsboom, D., Fried, E., Epskamp, S., Waldorp, L., Van Borkulo, C., Van Der Maas, H., & Cramer, A. (2017). False alarm? A comprehensive reanalysis of “Evidence that psychopathology symptom networks have limited replicability” by Forbes, Wright, Markon, and Krueger. Journal of Abnormal Psychology, 126(7), 989–999. http://doi.org/10.17605/OSF.IO/TGEZ8
Forbes, M. K., Wright, A. G. C., Markon, K. E., & Krueger, R. F. (2017a). Evidence that Psychopathology Symptom Networks have Limited Replicability. Journal of Abnormal Psychology, 126(7), 969–988. http://doi.org/10.1037/abn0000276
Forbes, M. K., Wright, A. G. C., Markon, K. E., & Krueger, R. F. (2017b). Further evidence that psychopathology networks have limited replicability and utility: Response to Borsboom et al. and Steinley et al. Journal of Abnormal Psychology, 126(7), 1011–1016.
Steinley, D., Hoffman, M., Brusco, M. J., & Sher, K. J. (2017). A Method for Making Inferences in Network Analysis: Comment on Forbes, Wright, Markon, and Krueger (2017). Journal of Abnormal Psychology, 126(7), 1000–1010.
Tio, P., Epskamp, S., Noordhof, A., & Borsboom, D. (2016). Mapping the manuals of madness: Comparing the ICD-10 and DSM-IV-TR using a network approach. International Journal of Methods in Psychiatric Research, 25(4), 267–276. http://doi.org/10.1002/mpr.1503
Verhelst, N. D. (2008). An Efficient MCMC Algorithm to Sample Binary Matrices with Fixed Marginals. Psychometrika, 73(4), 705–728. http://doi.org/10.1007/s11336-008-9062-3
Footnotes
- In fact, we postulate that the networks replicate too well, likely due to strong causal effects being imposed by the skip-structure and zero-imputation underlying the dataset.
- Side note: I spent about two weeks doing this manually in excel before learning the 1-second R command that can be used for this purpose. It was a great learning experience on learning why picking up programming skills is vital.
Pingback: Looking back at 2018 - Eiko Fried