We recently had a new paper accepted, for which we estimated networks of the 7 subscales of the Contingencies of Self-Worth Scale. The paper was written by Giovanni Briganti uses open data of 670 participants.
I conducted some sensitivity and robustness analyses for the paper, and became interested in all the different ways in which one can summarize the subscale scores (e.g sum scores vs factor scores), and how this affects the resulting correlation matrices and regularized partial correlation networks. Since a lot of this was beyond the scope of the paper, I wanted to write this up here, in a tutorial with open code and open data. This seems especially relevant because more and more researchers are interested in modeling networks of meaningful constructs, and I firmly believe that subscales can have a lot of advantages over individual items in case they represent such meaningful constructs; see Giovanni’s paper — and also our recent paper on schizotypal personality — for examples. Folks with more time & talent could easily turn this tutorial into a simulation study. Hint hint.
In any case, you can find data and code for this tutorial here. I will not show all code below, only the most relevant parts. Now, let’s start to mix apples and oranges! Overall, the goal of the tutorial here is to estimate correlation coefficient and regularized partial correlation networks based on either sum-scores or factor scores of the items belonging to each of the 7 subscales. Finally, we will also explore what happens if we estimate the factor scores not based on simple structure, but allow for cross-loadings.

Introduction: generalized network psychometrics
Before we start, please make sure to add Sacha Epskamp’s paper on generalized network psychometrics to your reading list, which is the first comprehensive publication on combining latent variable models and network models. Sacha wrote the R-package lvnet, which allows you to tackle the challenge we faced in Giovanni’s paper in one single step. lvnet first takes out the shared variances of items and models them as latent variables, and then models the the relations among the latent variables as a network. This is called a latent network model — here an example from Sacha’s paper:
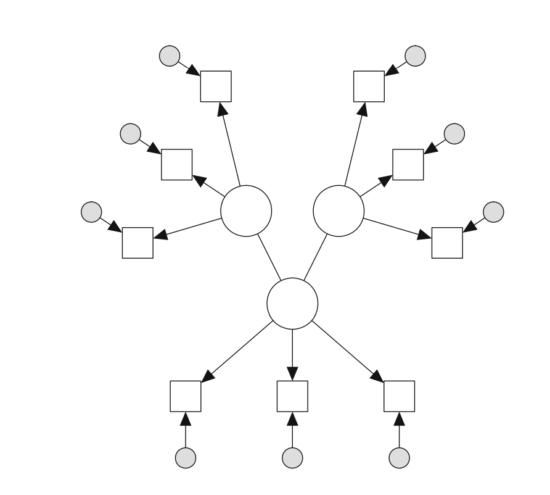
Unfortunately, we were unable to use lvnet for the paper because we had too many items; lvnet does not scale well beyond 20 or so items. If you have fewer items, this is likely what you want to do.
Comparison of zero order correlations
In a first step, we estimate correlations of the 7 domains estimated via sum-scores, and compare that to correlations among the 7 domains estimated via factor-scores (using a confirmatory factor analysis).
We estimate sum-scores by adding up items, and estimate factor scores in a 7-factor model in lavaan:
cmodel <-  ' FS =~ c7 + c10 + c16 + c24 + c29
             C  =~ c3 + c12 + c20 + c25 + c32
             A  =~ c1 + c4 + c17 + c21 + c30
             GL =~ c2 + c8 + c18 + c26 + c31
             AC =~ c13 + c19 + c22 + c27 + c33
             V  =~ c5 + c11 + c14 + c28 + c34
             OA =~ c6 + c9 + c15 + c23 + c35 '

fit <- cfa(cmodel, data=data) |
Fit is surprisingly good for a 7-factor simple structure model1, with a significant chi-square of ~1593 and 539df in n=680; CFI=0.91, TLI=0.9, and RSMEA=0.05.
In the next step, we now estimate and visualize correlations among either sum scores or factor scores:
sum <- read_delim("sumscoredata.csv", ";", escape_double = FALSE, trim_ws = TRUE)
factor <- read_delim("factorscoredata.csv", ";", escape_double = FALSE, trim_ws = TRUE)

cor_sum <- cor_auto(sum)
cor_fac <- cor_auto(factor)

layout(t(1:2))
nw_sum <- qgraph(cor_sum, details=T, maximum=.72, title="correlation among sum scores")
nw_fac <- qgraph(cor_fac, details=T, title="correlation among factor scores")
dev.off() |
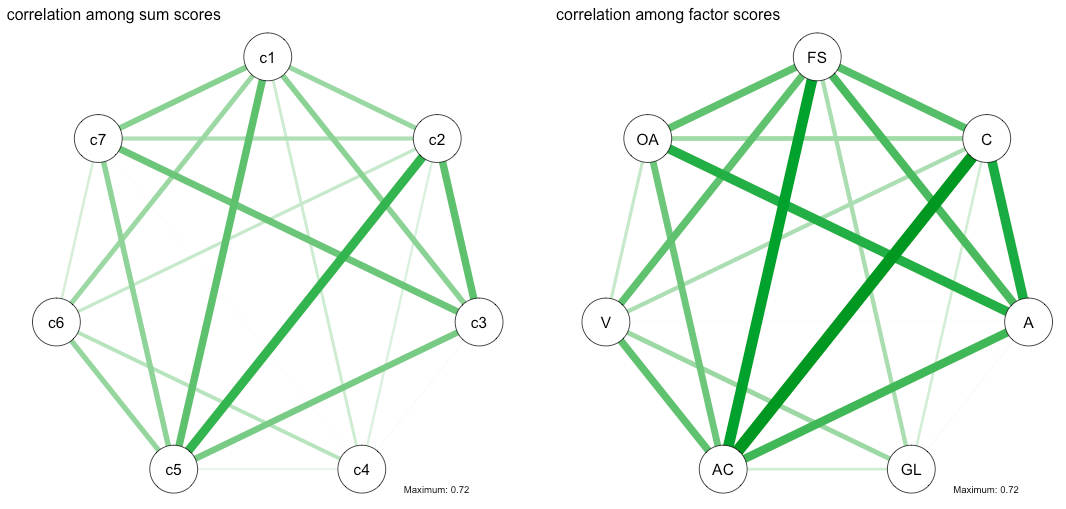
As you can see, the correlations in the case of factor scores (compared to sum-scores) are considerably larger, due to disattenuation of the correlation coefficients due to unreliability. That is, if we assume that variation in the latent variables causes variation in the observed items, i.e., if we believe that the observed items are passive indicators that are caused by the latent variable — an assumption I find highly plausible given the nature of the scale — then the results can be interpreted in the sense that the factor scores remove measurement error. This increases relationships between subscales because we have more reliable subscale scores now2.
The next code snippet shows the sum of all correlations for each case, and you can see that the sum of correlations in case of factor scores is larger compared to the sum scores:
sum(abs(cor_sum[upper.tri(cor_sum)])) # 4.91 sum(abs(cor_fac[upper.tri(cor_fac)])) # 6.95 |
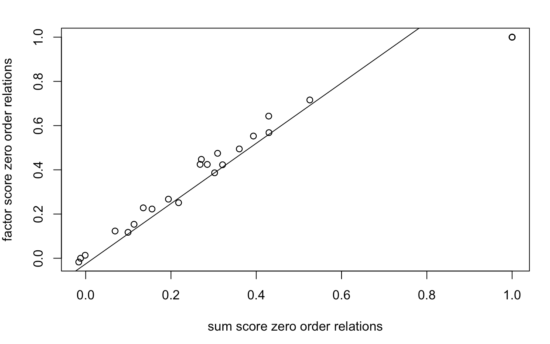
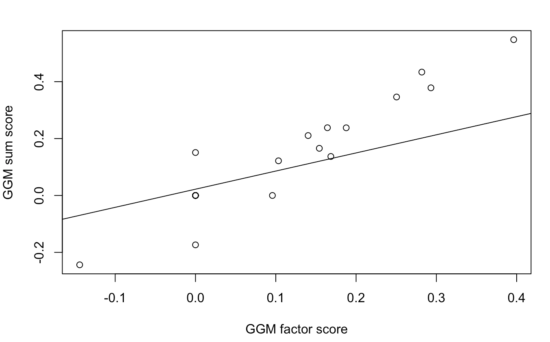
The two correlation matrices are nearly perfectly linearly related, with a correlation of 0.99:
Comparison of regularized partial correlation networks
In a second step, we estimate regularized partial correlation networks (Gaussian Graphical Models, GGMs) on the data. They look (somewhat?) different3, and once again, the coefficients in the GGM are stronger:
n1 <- estimateNetwork(sum, default="EBICglasso", threshold=TRUE, lambda.min.ratio=0.001) n2 <- estimateNetwork(factor, default="EBICglasso", threshold=TRUE, lambda.min.ratio=0.001) layout(t(1:2)) plot1 <- plot(n1, layout='spring', title="sum score GGM", details=TRUE, maximum=0.55) plot2 <- plot(n2, layout=plot1$layout, title="factor score GGM", details=TRUE) dev.off() |
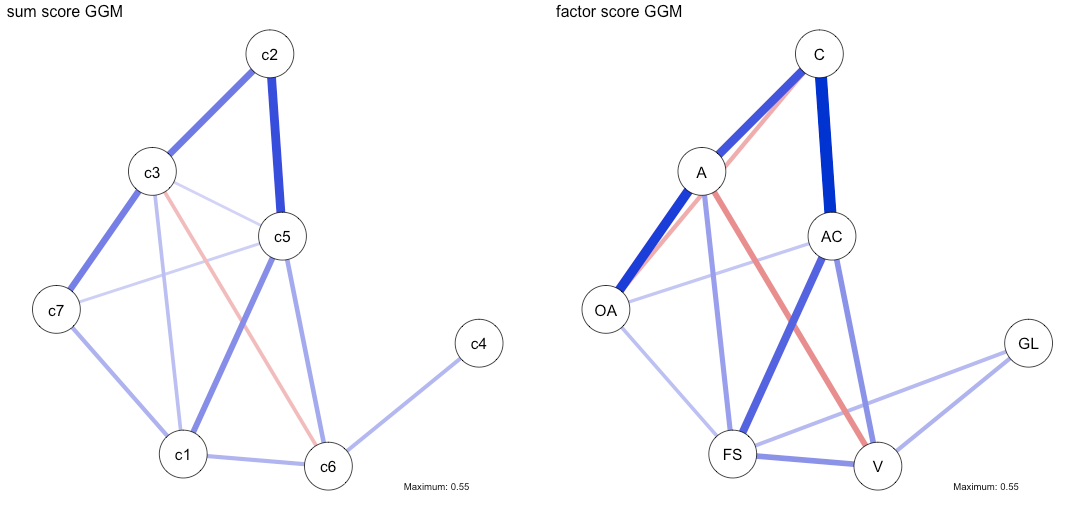
The correlation among the two adjacency matrices is 0.92, and again, the coefficients seem to be linearly related and stronger in case of the factor scores.
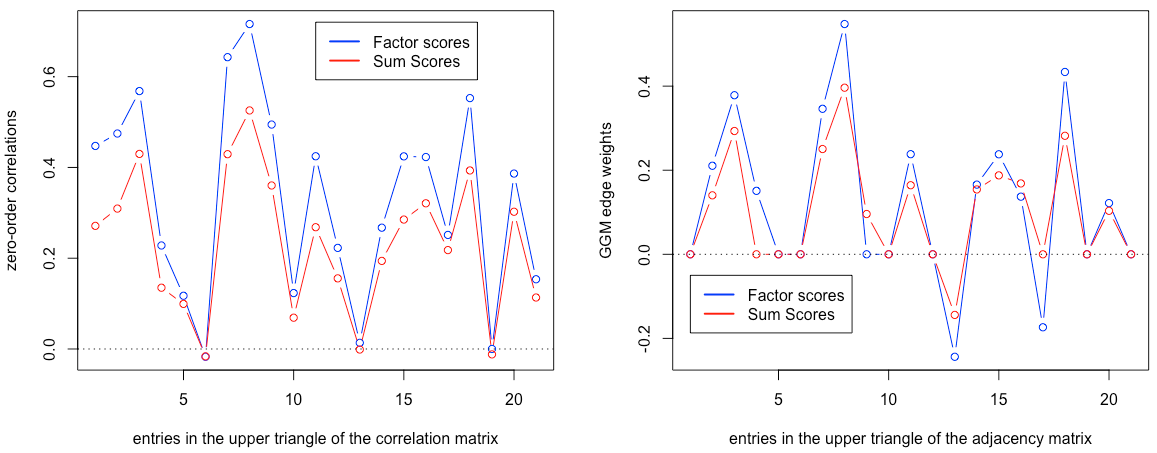
The plot below summarizes both correlations and regularized partial correlation structures for sum scores vs factor scores:
Conclusion
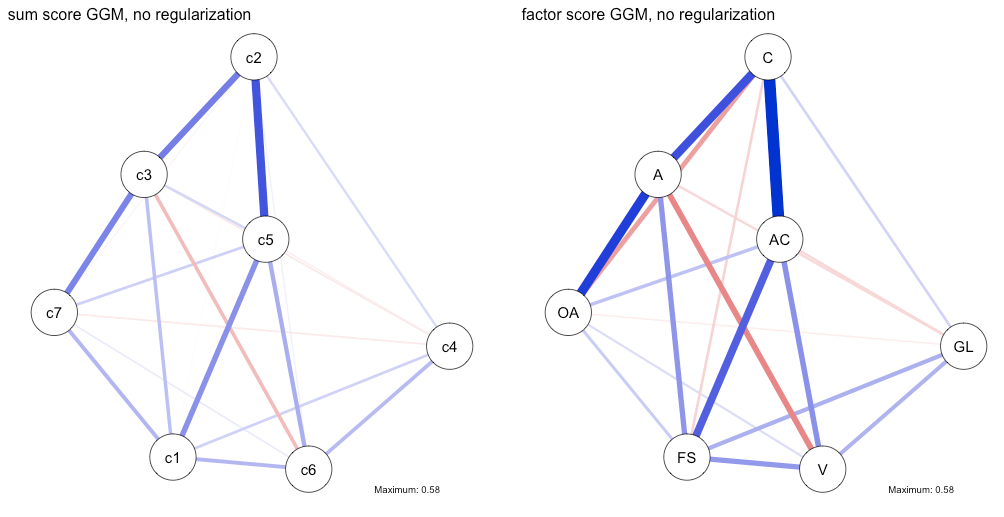
The specific results in this paper are entirely consistent with the disattenuation hypothesis: correlations and regularized partial correlations among subscales estimated based on factor scores of the 7 subscales are stronger than those estimated based on sum scores. And while the two GGMs differ in that the factor score GGM has 2 negative edges, the analysis here reveals that this is likely due to the fact that the lasso put these specific negative relations to zero in the sum score GGM. This is the case because the reliability of the sum score subscales was lower, which translates into lower power for the lasso to detect relations above zero. We can sort of test this by estimating a partial correlation network without regularization, in which case we’d expect that the coefficient for the negative edge that is featured in the regularized factor score GGM, but not in the regularized sum score GGM, would be slightly negative. This is indeed the case:
n1pcor <- estimateNetwork(sum, default="pcor") n2pcor <- estimateNetwork(factor, default="pcor") layout(t(1:2)) plot1 <- plot(n1pcor, layout=plot1$layout, title="sum score GGM, no regularization", details=TRUE, maximum=0.58) plot2 <- plot(n2pcor, layout=plot1$layout, title="factor score GGM, no regularization", details=TRUE) dev.off() |
Overall, I’d like to see more simulation work on this, but I see no principled obstacle for using factor scores for subscales, and advantages such as removing measurement error (if that indeed makes sense of the items & construct under scrutiny).
Updates
This blog led to some interesting discussions, and I would like to highlight two points specifically.
First, as pointed out by Carlo Chiorri, correlations among factors scores tend to be inflated in case of cross-loadings when simple structure is enforced. Assume we have a data-generating model with some cross-loadings (i.e. some items load on more than 1 factor). Now we fit two models: model 1, a simple structure CFA model as we do above, and model 2, a factor model where we model all cross-loadings via ESEM (Exploratory Structural Equation Modeling). The inter-correlations among factors scores in model 1 will be larger than in model 2. This has been shown in the 2013 paper by Marsh and colleagues.
If we estimate this ESEM model and compare the resulting networks to the two models we estimated above (sum-score and factor-score networks), we get a network model that is somewhere between the sum-score network (smaller relations) and the factor score network (larger relations). This makes sense: there is some disattenuation (inflation?), but it is smaller than in the simple structure model.
It’s been a while since I fit ESEM models in lavaan, if somebody knows a quick way to do that, please let me know and I’ll add the code here.
Second, Erikson Kaszubowski summarized some general issues of using factor scores as observed variables, which are worth quoting in full:
The problem of using factor score in any subsequent analysis as an observed variable is a very old problem in factor analysis literature, as you probably know. It’s mainly a problem because there is an infinite number of solutions that satisfy the equations used to estimate factor scores. Most software packages (like lavaan) simply spit the least square estimates for the factor scores, which have some interesting properties (well, they ARE least square estimates and they also maximize factor score and latent factor correlation). But they don’t preserve latent variable correlation: even if the model has orthogonal latent variables, the factor scores computed from the solution will correlate.
Correlation between factor scores computed using least square estimates are usually an overestimate of latent factor correlation (compare cor(factor_scores) with inspect(lav_obj, ‘std.all’)$psi. And the problem goes deeper: we can build factor scores that are orthogonal or better reflect the correlation between latent variables (the ‘Anderson’ and ‘ten Berge’ methods in ‘psych’ package), but, given the infinite number of possible solutions, there is some arbitrarity in factor score solutions and their correlation matrix.
Given factor scores indeterminacy, I would suggest three alternatives to using (least squares) factor scores:
(1) Apply the latent variable network model from lvnet to single indicator latent variable using some reliability estimate to fix parameters.
(2) Apply the network model directly to the estimated latent variable correlation (or covariance) matrix. Not the best alternative, but still possible.
(3) Evaluate factor score indeterminacy to guarantee the indeterminacy is small enough to be ignored and proceed with the analysis with factor scores anyway.
You can find code & data here; source for the image “apples & oranges”: Michael Johnson, flickr.
- Simple structure: no cross-loadings
- Note that if the reflective latent variable model would not be the data generating model, there is no such thing as removing measurement error, and recent simulation work shows that factor scores can then lead to biased estimates.
- See code for why I changed lambda.