A new paper by Mohammad Afzali and colleagues was published a few days ago in the Journal of Affective Disorders, entitled “A Network Approach to the Comorbidity between Posttraumatic Stress Disorder and Major Depressive Disorder: the Role of Overlapping Symptoms”.
The authors estimate the network structure of 36 symptoms in 909 participants, and, as common in the literature, report (1) especially strong edges, (2) especially central symptoms, and (3) bridge symptoms that connect PTSD and MDD symptoms. In terms of sample size and power, this is a typical paper, and also similar to many of the papers presented at the ABCT conference last weekend that you can find here.
I want to use this paper as an opportunity to talk about power issues in network modeling, and show you how to estimate the robustness / accuracy / stability of the networks you obtain. I believe there is a real danger of an upcoming replicability crisis consistent with the rest of psychology, given that we are using highly data-driven network models,; below are some things you can do to look at your results in more detail.
Power issues in network analysis
This blog is a brief non-technical summary of a paper on robustness and replicability that is currently under revision at Behavioral Research Methods entitled “Estimating Psychological Networks and their Accuracy: A Tutorial Paper”.
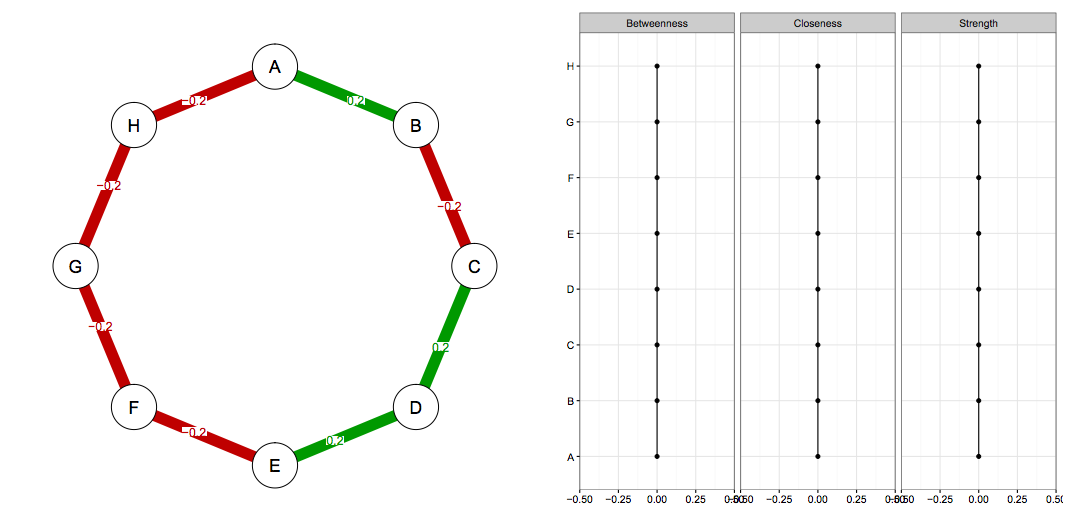
Imagine we know the true network structure of a network with 8 nodes, and it looks like this (left side network, right side centrality values). All edges are equally strong, and that means that all centrality estimates are also equally strong.
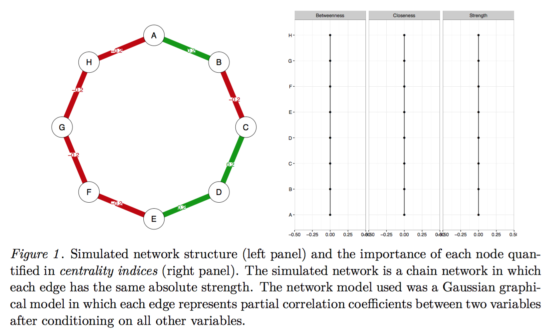
And now imagine we take this true network, and simulate data from it for n=500. This gives us a dataset with 8 variables and 500 people, and now we estimate the network structure in this dataset, along with the centrality values.
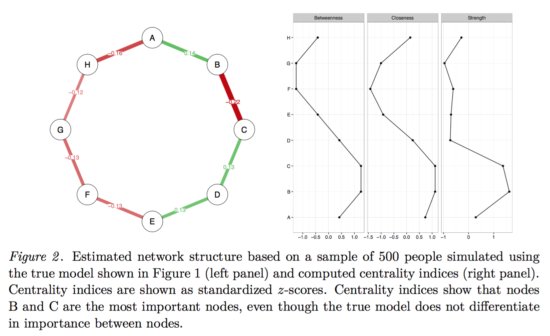
As you can clearly see, neither edges nor centrality estimates are equally strong anymore, and if we were to write a paper on this dataset, we would (falsely) conclude that B-C is the strongest edge, and that B has the highest centrality. Because we simulated the data from a true model, we know all that all edges and centrality estimates are equally strong.
The issue is more pronounced with (a) fewer participants, (b) more nodes, or (c) both. The reason for this is that the current state-of-the-art network models we use in cross-sectional data, regularized partial correlation networks, require a very large amount of parameters to estimate.
I will to introduce two methods briefly that allow you to get to the bottom of this problem in your data.
Edge weights accuracy
First, we want to look into the question how accurate we estimate edge weights of a network. For this purpose, we take a freely available dataset (N=359), and estimate a regularized partial correlation network in 17 PTSD symptoms, which looks like this:
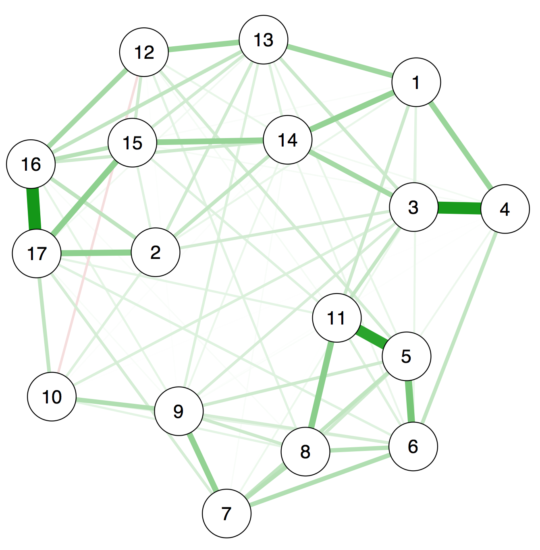
Using a single line of code in our new R-package bootnet to estimate edge-weights accuracy, you can now estimate the accuracy of the edge weights in the network, leading to the following plot:
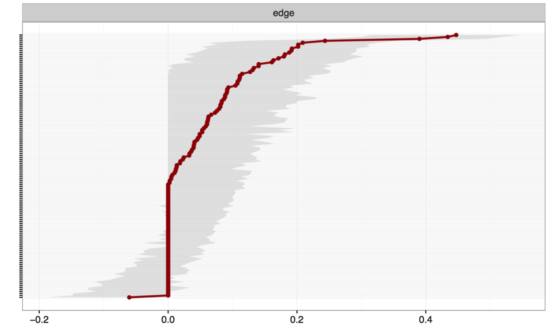
On the y-axis you have all edges in the network (I omitted the labels of all edges here, otherwise the graph gets very convoluted), ordered from the highest edge (top) to the lowest edge (bottom). Red dots are the edge weights of the network, and the grey area indicates the 95% CI around the edge weights. The more power you have to estimate the network (the fewer nodes / the more participants), the more reliable your edges will be estimated, the smaller the CIs around your edges will be. In our case, the CIs of most edges overlap, which means that the visualization of our network above is quite misleading! While certain edges look stronger than some weaker edges, they are actually not different from each other because their 95% CIs overlap. It’s a bit like having a group of people with a weight of 70kg (CI 65-76kg), and another group with 75kg (CI 70-80kg): these 2 point estimates do not differ from each other because their 95% CIs overlap. In sum, with 17 nodes we would prefer to have many more participants than the 359 we have here.
If we now want to look whether specific edges are different from each other, we can run the edge-weights different test in bootnet:
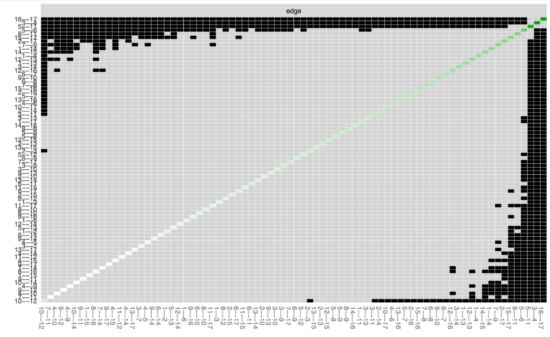
Here you can see all edges on both x-axis and y-xis, and in the diagonal the value of the edge weights; black boxes indicate significant difference between 2 edges. After looking at the substantial overlap of CIs above, it is not surprising that most edges do not differ from each other. (Note that this test does not control for multiple testing; more about this in the manuscript).
Centrality stability
The second big question we can try to answer is the stability of centrality. Let’s look at the centrality estimates of our network first, and focus on strength centrality, which is the absolute sum of edges that connect a given node to other nodes.
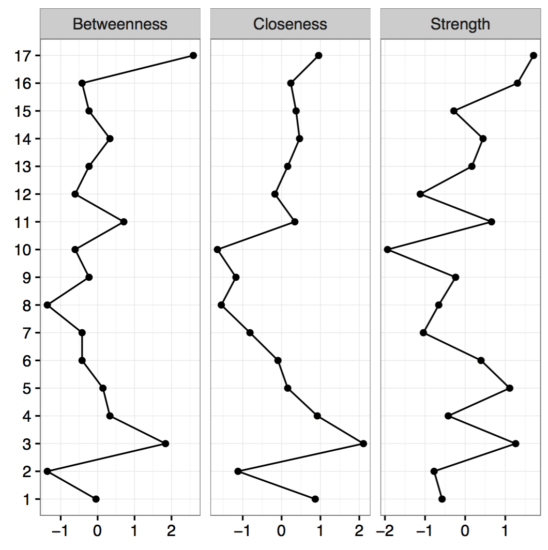
As you can see, node 17 has the highest strength centrality, but is the node actually more central than node 16 which has the second highest strength?
Instead of bootstrapping CIs around the centrality estimates (which are unbootstrappable, see supplementary of the paper), we look into the stability of centrality. The idea comes from Costenbader & Valente 2003 and is straightforward: we have a specific order of centrality estimates (17 is the most central one, then comes 16, then 3, etc), and now we delete people from our dataset, construct a new network, estimate centrality again, and do this many thousand times. If the order of centrality in our full dataset is very similar to the order of centrality in a dataset in which we dropped 50% of our participants, it means that the order of centrality is stable. If deleting only 10% of the our participants, on the other hands, leads to a fundamentally different order of centrality estimates (e.g. 17 is the least central now), this does not speak to the stability of centrality estimates.
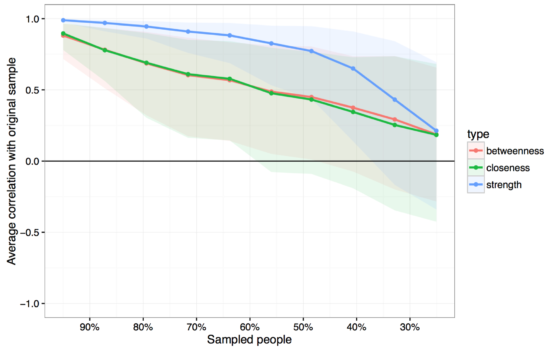
You see that strength centrality (blue) is more stable than betweenness or closeness, which is what we have often found when using bootnet in numerous datasets now. In our case, the correlation between the order of strength centrality in our full dataset with a dataset in which we (2000 times) sampled 50% of the participants is above .75, which isn’t too bad. In the paper, we introduce a centrality stability coefficient which tells you more about the stability of your centrality estimates.
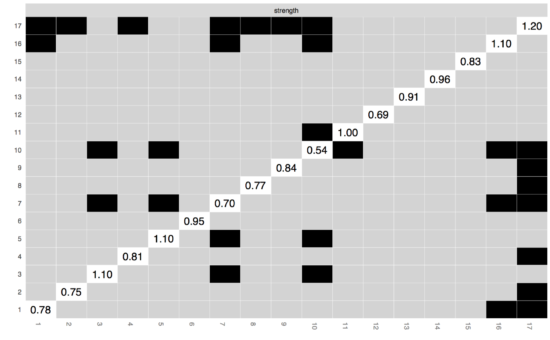
Finally, you can also check whether centrality estimates differ from each other, using the centrality difference test; node 17 is not more central than node 16. (Similar to the edge-weights difference test, this test does not control for multiple testing.)
FAQ
- “I have a network paper and didn’t investigate the robustness of my network!” – Welcome to the club :). You can start doing it from now on!
- “Do I have to use bootnet?” Hell no, if you have other / better ideas, you should definitely do that instead. bootnet is very new – the paper is not yet published – and there are probably many better ways to look into the robustness of network models. But it is a great start, and I’m very happy that Sacha Epskamp put so much work into developing the package and writing the paper about replicability with Denny Borsboom and me. For me personally, bootstrapping helped me to avoid drawing wrong conclusions from my data: if your most central node does not significantly differ from many other nodes in terms of centrality, you really don’t want to write up the symptom as being the most central, and if your visually strongest edge overlaps in CI with most other edges, you don’t want to conclude it is the most central edge.
- “But Eiko, what about time-series networks? bootnet only covers cross-sectional networks at present!” – Yes, we all need to write motivating emails full of beautiful and funny gifs to Sacha to shift his priorities! But seriously, we’re working on it. And please leave him alone, ok? 😉
References
– Afzali, M. H., Sunderland, M., Teesson, M., Carragher, N., Mills, K., & Slade, T. (2016). A Network Approach to the Comorbidity between Posttraumatic Stress Disorder and Major Depressive Disorder: the Role of Overlapping Symptoms. Journal of Affective Disorders. http://doi.org/10.1016/j.jad.2016.10.037
Background. The role of symptom overlap between major depressive disorder and posttraumatic stress disorder in comorbidity between two disorders is unclear. The current study applied network analysis to map the structure of symptom associations between these disorders.
Methods. Data comes from a sample of 909 Australian adults with a lifetime history of trauma and depressive symptoms. Data analysis consisted of the construction of two comorbidity networks of PTSD/MDD with and without overlapping symptoms, identification of the bridging symptoms, and computation of the centrality measures.
Results. The prominent bridging role of four overlapping symptoms (i.e., sleep problems, irritability, concentration problems, and loss of interest) and five non-overlapping symptoms (i.e., feeling sad, feelings of guilt, psychomotor retardation, foreshortened future, and experiencing flashbacks) is highlighted.
Limitations. The current study uses DSM-IV criteria for PTSD and does not take into consideration significant changes made to PTSD criteria in DSM-5. Moreover, due to cross-sectional nature of the data, network estimates do not provide information on whether a symptom actively triggers other symptoms or whether a symptom mostly is triggered by other symptoms.
Conclusion. The results support the role of dysphoria-related symptoms in PTSD/MDD comorbidity. Moreover, Identification of central symptoms and bridge symptoms will provide useful targets for interventions that seek to intervene early in the development of comorbidity.
– Epskamp, S., Borsboom, D., Fried, E. I. (under revision). Estimating psychological networks and their accuracy: a tutorial paper. Behavioral Research Methods. (PDF).
The usage of psychological networks that conceptualize psychological behavior as a complex interplay of psychological and other components has gained increasing popularity in various fields of psychology. While prior publications have tackled the topics of estimating and interpreting such networks, little work has been conducted to check how accurate (i.e., prone to sampling variation) networks are estimated, and how stable (i.e., interpretation remains similar with less observations) inferences from the network structure (such as centrality indices) are. In this tutorial paper, we aim to introduce the reader to this field and tackle the problem of accuracy under sampling variation. We first introduce the current state-of-the-art of network estimation. Second, we provide a rationale why researchers should investigate the accuracy of psychological networks. Third, we describe how bootstrap routines can be used to (A) assess the accuracy of estimated network connections, (B) investigate the stability of centrality indices, and (C) test whether network connections and centrality estimates for different variables differ from each other. We introduce two novel statistical methods: for (B) the correlation stability coefficient, and for (C) the bootstrapped difference test for edge-weights and centrality indices. We conducted and present simulation studies to assess the performance of both methods. Finally, we developed the free R-package bootnet that allows for estimating psychological networks in a generalized framework in addition to the proposed bootstrap methods. We showcase bootnet in a tutorial, accompanied by R syntax, in which we analyze a dataset of 359 women with posttraumatic stress disorder available online.
Thanks for the post! Do you think there will be a point where PhD students in applied research (such as health psychological interventions) can skip learning SEM and should just delve into network models? 🙂
I really like SEM very much, and knowing SEM is very helpful for understanding network models. I believe that PhD students in applied research don’t learn SEM enough, which is why there are often misconceptions and problems.
I talk about a few examples here: http://eiko-fried.com/common-problems-of-factors-models-in-psychopathology-research/
SEM is also very closely related to network modeling, see the great book chapter Sacha wrote on the topic: https://arxiv.org/abs/1609.02818
Great, thanks!
Oh, another question. How deeply should one delve into SEM? I think there’s like 3 years worth of mathematics if one really wants to understand everything.
Sorry, I have no answer for that. It depends on what you want to do later. In my personal opinion, it’s impossible for applied researchers to understand the exact math behind each and every model (there are simply too many models used now), and it’s also not necessary. Get a general grasp of what the models do, and what they don’t do, try to understand the assumptions the models have — that’s a good start. And to learn that for basic SEM models such as EFA / CFA certainly doesn’t take 3 years if you put effort into it.
Oh, I hadn’t even thought that EFA / CFA are SEM… In my field (health psych) when I hear talk about SEM, it’s mostly mediation/moderation/path models. I.e. complicated jumbles of boxes and arrows…
Isn’t one other reason why the estimates of centrality over such a simple but perhaps non-typical network, even with a sample of 500 people trying to estimate only 8 variables that the measures we are using are insufficiently precise? In the presence of no noise they perform perfectly but are less than robust when there is sufficient variance in the sample(s), so investigations to determine the nature of more robust measure (whatever form that might be) are also warranted?
Thanks Bryan. Are you aaying we ought to explore more inherently robust measures of centrality? Great idea. We use degree, closeness and betweenness bc they are the standard in other fields. Do you have any suggestions?
Of course there are other graph theoretical measures aimed to capture more global aspects of the network, such as clustering or smallworldness, but these provide information the graph, not individual nodes.
Note also that many of these were developed for unweighted networks, and make less sense in our case of weighted networks (e.g. smallworldness).
Hi Eiko, Yes in my somewhat round about fashion that is what I was saying. Whatever the current crop of centrality measures are as applied to weighted networks they do not seem to be robust. As to what a more robust measure is, sorry I have no immediate suggestions. But maybe centrality is not the best measure. There are summary measures that balance local and global properties, like Spectral graph approaches.
Hello, can you please post the code that was used to generate the plots shown here? I’d like to see how bootnet and qgraph can be used together. Thanks!
Hi Andrew, we have a R-tutorial paper on exactly the topic you’re looking for, with all the R syntax in the supplementary: it’s the paper that this blog is about.
Or did I misunderstand your question?
https://arxiv.org/abs/1604.08462
And here the supplementary materials of the paper:
http://sachaepskamp.com/files/bootnet_Supplementary.pdf
Hi Eiko,
Sorry, I didn’t see the note in the references section about the paper containing R syntax. Specifically, what I wanted to know is whether bootnet can work with qgraph objects. Among the many great features of qgraph, I particularly like (and use extensively) the ability to plot networks for “correlation” matrices that are not strictly Pearson or Spearman correlation matrices. I use qgraph to plot the networks corresponding to mutual information matrices (actually, a normalised variant: symmetric uncertainty). If the matrix has the same structure as a correlation matrix, qgraph can plot it. This is much more powerful than plotting the matrix as a correlogram and shows the community structure. However, it appears that bootnet is for used specifically for measuring the robustness of regularised partial (Pearson?) correlation networks. I’m wondering whether if can be used in a more general way. I’d like to have the freedom to study other types of network, such as those with edge weights corresponding to mutual information instead of Pearson correlation. Is this possible? I realise this is a corner case; I’m a particle physicist and use qgraph as a method for feature exploration/selection in the process of building a machine learning model for subatomic particle identification!
Best regards,
Andrew.
Hi Andrew, thanks for your follow-up! Exciting to have input from people outside our small field & community. Sacha will also be happy to hear his package has made it to particle physics ;).
Checking ?bootnet:
bootnet(data, nBoots = 1000, default = c(“none”, “EBICglasso”,
“pcor”, “IsingFit”, “IsingLL”), …
You’re right that bootnet doesn’t bootstrap zero-order correlation networks. This is because in our case of symptom networks, it may not be very interesting to know that there is a connection between symptom A and B in a zero-order correlation network if it completely disappears once you control for C in a partial correlation network.
Also, a zero-order correlation network is not really a model; you just visualize a correlation table. The Ising Model or the Gaussian Graphical Model (regularized partial correlation networks) are models, so maybe bootstrapping coefficients makes a bit more sense here. Are you worried about the accuracy of your zero-order correlation (or mutual information edges)? I guess you can just bootstrap them the same way, not sure how informative that is.
Would you mind sharing your code regarding mutual information (here or via email to eiko.fried@gmail.com)? That sounds interesting and I haven’t seen it so far in this field.
Maybe drop a brief email to Sacha and ask him if he could implement an option in bootnet for zero-order correlations.
Hi Eiko,
I discovered qgraph when I was searching for a means to visualise large correlation matrices. Correlograms are fine for a few variables, but for more than a dozen it becomes difficult to interpret the visualisation, and you learn nothing about the community structure in the data. To the best of my knowledge, nobody in my field has used networks to study correlation matrices. Everyone in particle physics uses correlograms — even really big ones. Usually these are just huge tables of numbers. I think we can do better than that!
I don’t run glasso or create partial correlation networks for anything that doesn’t come from a Pearson correlation matrix. I guess it doesn’t make much sense to do so. For mutual information matrices I simply want to visualise the correlation table, as you say. Studying the robustness of the network is a “nice to have” feature, but perhaps not strictly necessary; I have about 100 nodes and about 85000 observations in my data. Maybe my sample size is big enough.
Code: I started writing code to calculate the mutual information matrix for my data, and was patting myself on the back for having has such a cool idea, but then discovered that it’s already been thought of by folks in the bioinformatics community! It seems this is already old hat. D’oh! On the bright side, there’s already a number of implementations in R for doing this, and some have already been optimised so that they’re likely to be faster than the code I developed. Try WGCNA from CRAN: https://cran.r-project.org/web/packages/WGCNA/index.html
You’ll need MINET, which has been removed from CRAN. The version in Bioconductor didn’t work for me. Use this: https://github.com/cran/minet
Then calculating the mutual information matrix is as simple as:
data <- matrix(rnorm(85000), ncol = 100) # For testing
mat <- mutualInfoAdjacency(data)
mi.cor <- mat$AdjacencySymmetricUncertainty
Best regards,
Andrew.
Fantastic, thanks for sharing Andrew.
EDIT: Oops, ran out of levels there, need to add a deeper tree structure there.
Pingback: Tutorial: how to review psychopathology network papers? | Psych Networks
Pingback: Network replicability: a cross-cultural PTSD study across four clinical datasets | Psych Networks
Pingback: Network models do not replicate ... not. | Psych Networks
Pingback: A summary of my academic year 2017 – Eiko Fried
Pingback: Network stability part II: Why is my network unstable? | Psych Networks
Pingback: Bootstrapping edges after regularization: clarifications & tutorial | Psych Networks
Pingback: How to interpret centrality values in network structures (not) | Psych Networks