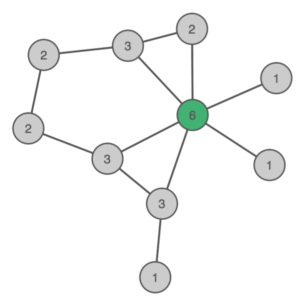
When we estimate the centrality of nodes in networks, one metric that is commonly used is node strength centrality or degree centrality. In unweighted networks were edges are either 0 or 1, this is simply the sum of edges.
Let’s create a brief example in R: we create an adjacency matrix that encodes the edges among nodes in a network, and color the node with the most connections (6 of them) green:
AM <- matrix(0,10,10)
AM[1,2] <- AM[2,1] <- AM[2,3] <- AM[3,2] <- AM[2,4] <- AM[4,2] <- AM[3,4] <- AM[4,3] <- AM[3,6] <- AM[6,3] <- AM[3,8] <- AM[8,3] <- AM[3,9] <- AM[9,3] <- AM[3,10] <- AM[10,3] <- AM[4,7] <- AM[7,4] <- AM[5,7] <- AM[7,5] <- AM[5,10] <- AM[10,5] <- AM[9,10] <- AM[10,9] <- 1
gr <- list(c(1,2,4:10), 3)
names <- c("1","3","6","3","2","1","2","1","2","3")
N <- qgraph(AM, groups = gr, color=c('#cccccc', '#3CB371'), labels=names,
              border.width=3,edge.width=2, vsize=9,
border.color='#555555', edge.color="#555555", label.color="#555555") |

In weighted networks where edge weights can differ from each other in strength, we simply add up all edge weights to estimate node strength centrality or degree centrality of each node. So if our edges between the green node and its 6 neighbors were, for instance, 0.3, 0.1, 0.5, 0.9, 1, and 0.5 (instead of all being 1 as in the unweighted example above), the centrality of the node would be the sum of these edges: 3.3.
Now comes the tricky part: if some of these edges are negative, the centrality estimate for the node would still be the same, because we add up the absolute values of edge weights. Why? The explanation really isn’t the very best, but here we go:
Because other fields have been doing so, and the centrality metrics are taken from other fields 😉 …

In their new paper “Identifying Highly Influential Nodes in the Complicated Grief Network” that was published recently in the Journal of Abnormal Psychology, Robinaugh et al. discuss why in the case of psychopathology the absolute sum of edge weights may not be the best approach to look into the clinical importance of a node in a network, especially when there are many negative edges present. They convincingly argue that a node in a symptom or problem network that has many negative edges (i.e. activation of that mode may diminish activation in other nodes) should not be considered as a highly problematic node one would want to intervene on in therapy, because it may actually reduce the severity of other problems. They introduce a new centrality metric they call Expected Influence (EI) that takes into account negative associations among nodes, and assess the performance of EI in both a simulation study and an longitudinal dataset of bereaved individuals.
Abstract:
The network approach to psychopathology conceptualizes mental disorders as networks of mutually reinforcing nodes (i.e., symptoms). Researchers adopting this approach have suggested that network topology can be used to identify influential nodes, with nodes central to the network having the greatest influence on the development and maintenance of the disorder. However, because commonly used centrality indices do not distinguish between positive and negative edges, they may not adequately assess the nature and strength of a node’s influence within the network. To address this limitation, we developed 2 indices of a node’s expected influence (EI) that account for the presence of negative edges. To evaluate centrality and EI indices, we simulated single-node interventions on randomly generated networks. In networks with exclusively positive edges, centrality and EI were both strongly associated with observed node influence. In networks with negative edges, EI was more strongly associated with observed influence than was centrality. We then used data from a longitudinal study of bereavement to examine the association between (a) a node’s centrality and EI in the complicated grief (CG) network and (b) the strength of association between change in that node and change in the remainder of the CG network from 6- to 18-months postloss. Centrality and EI were both correlated with the strength of the association between node change and network change. Together, these findings suggest high-EI nodes, such as emotional pain and feelings of emptiness, may be especially important to the etiology and treatment of CG.
— Robinaugh, D. J., Millner, A. J., & McNally, R. J. (2016). Identifying highly influential nodes in the complicated grief network. Journal of Abnormal Psychology, 125(6), 747–757. http://doi.org/10.1037/abn0000181.

The reason we use absolute values is a bit more involved though than simply “because other fields use it”. Thing is, I shouldn’t be able to arbitrarily recode an item to its reverse and completely change the analysis. For example, if I recode neuroticism indicators in a personality network to emotional stability I would get positive connections rather than negative connections between neuroticism and extroversion indicators.
Now, I think it makes sense to not make edges absolute in the case where each node has the same interpretation. This is what you get when you make a network with *only* symptoms in there: every node indicates that more = bad. Then, negative edges could be interpreted as inhibiting. But as soon as I add a node that does not have the same interpretation, such as “drinking a vegetable juice” or “watching TV”, it becomes much more tricky.
Thanks Sacha, I had actually hoped you would comment on this to clarify. I agree that EI seems a specific metric for specific cases and may make little sense in numerous other contexts. But this very specific case (networks of only symptoms coded the way that higher = more problems) seems presently commonplace in cross-sectional network analysis, so I think it’s a very cool extension. On the other hand, one could of course also argue that in symptom networks you rarely have negative connections (except for the typical ones between e.g. insomnia and hypersomnia), so the difference between node strength centrality and expected influence is likely minor.
Pingback: New features in qgraph 1.5 | psychosystems.org blog