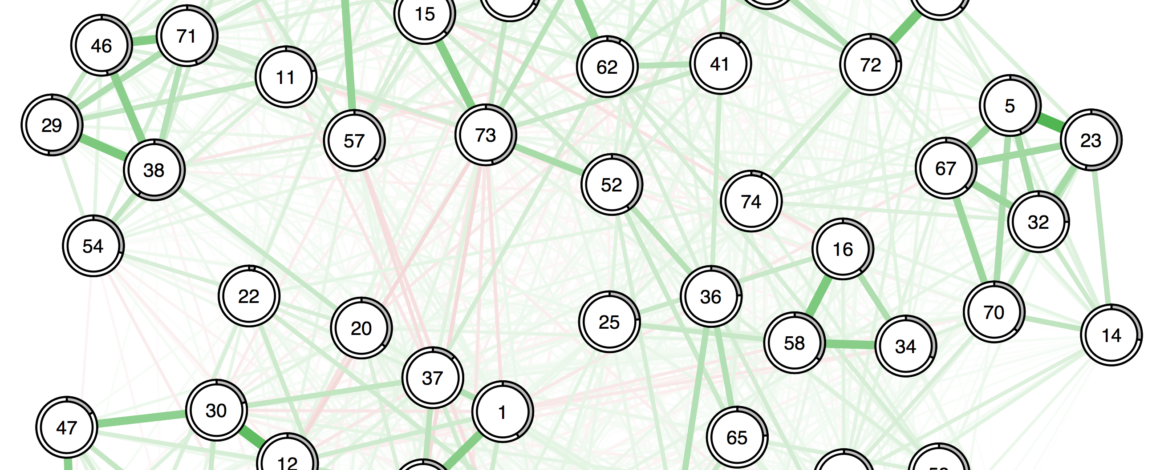
Do you want to know which network papers were published in 2017, or which papers investigated networks of psychosis symptoms? Would you like to know which papers used the Ising Model for binary data, or are you looking for data or syntax? This Network Repository serves these and similar queries. It’s kind of a dating website really, bringing researchers and networks together.
The goal of this project is to host a large collection of psychopathology network papers, including data, syntax, covariance and adjacency matrices. This not only provides a constantly updated literature overview, but also resources for future investigations. The project is the continuation of a paper for which we reanalyzed about 20 prior network papers. I had the idea for this repository on February 6th 2017, so bear with me … this will be work in progress for a few weeks and feedback is very welcome.
Contribute!
Please identify your papers in the table below, and add the missing information. If your paper isn’t listed yet, please add your paper.
Everybody can edit this Google Spreadsheet; I will review changes and copy them into a second non-public spreadsheet that generates the repository below. You can either upload files yourself and send me links, or send me the files via email and I will upload them for you.
Specifically, please send:
- Syntax (in most cases as .R file)
- Correlation tables of your items as .csv file (in most cases polychoric correlations for ordinal data and tetrachoric correlations for binary data)
- The adjacency matrix of your network as .csv file
- The thresholds of your network in case you estimated an Ising Model as .csv file
- If possible, your dataset as .csv file
I wrote a quick tutorial here that shows you how to extract this information from your data. If you cannot share your data, you can still share all the other information without problems.
Database
The papers are grouped into several categories to allow for easier searches. The covariance matrix represents the correlations among items, and adjacency matrix encodes the edge weights of the final network. For continuous items, the appropriate network model is the Gaussian Graphical Model that is estimated based on the covariance matrix. This means that the covariance matrix is sufficient to estimate the network model, which enables a lot of future analyses based on this repository. For binary data, the appropriate network model is the Ising Model that requires node-wise estimation. This means that you need the raw data to estimate the network structure. However, if you have the adjacency matrix and thresholds from a paper, you can reproduce the Ising Model and do not need the data.
Note that I’m still working on the table, and that it currently looks horrible on smart phones.
[gdoc key=”https://docs.google.com/spreadsheets/d/1ift7ZFPmeB78ofm2h0hdhbUVH3LxGFDrGcfE2_q2ZK8/edit?usp=sharing” datatables_paging=”false” datatables_dom=”false”]